
As connecting the Online and Offline Customer Journeys – involving online and offline touchpoints supported by their mobile devices – it is more important than ever for retailers of all sizes to focus on delivering an omnichannel customer experience, writes Practicology’s Sam Gaunt.
Got a mature analytics platform? Great! Have a physical store where customers interact with your business face-to-face? Excellent!
But are you connecting those experiences together?

Let’s put the two halves together!
You can’t get a comprehensive view of your relationship with your customers without tying together the offline and online streams together into one comprehensive snapshot.
Here are some of the ways that your potential customers interact with you online:
- General website browsing;
- Clicking on text and/or image advertisements; and
- Exposure to ad-supported streaming video
Information about this interaction can be captured through tools like Google Analytics or Adobe Marketing Cloud.
Here are some of the ways that your potential customers interact with you offline:
- Subscription forms for an email list notifying customers of upcoming promotions, completed in-person at the retail point of sale;
- Purchasing history, stored in a customer relationship management (CRM) system. This could be a remote CRM system like Salesforce, or a custom-built in house solution built on top of relational database systems such as MySQL, PostgreSQL, MariaDB, or Oracle.
Why is connecting online and offline interactions so vital to your business’s success?
If marketing data is stored in different silos, it is extremely difficult to identify the most successful marketing channels. Without connecting the acquisition channel data in the analytics tool and the purchase history in the CRM, you’re left scratching your head wondering how your potential customers became your actual customers.
The worst thing? This happens all the time! Who does it happen to?
- Hotels, where customers come to the website to book a reservation online, but then pay in-person at the hotel;
- Car dealerships, where customers browse cars and book test drives online, but pay and process transfer forms at the dealership, offline; and
- Many more businesses!
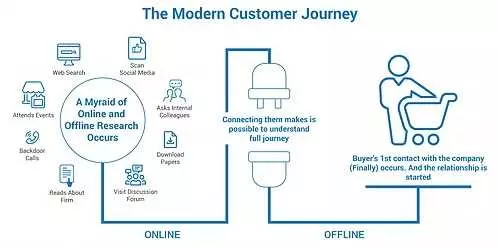
The two forms of customer-business interactions, brought together.
How do we put this all together?
Two simple steps:
- Join the datasets on the specific users; and
- Bring the datasets together.
There are several ways to tackle the first step:
- Store a cookie in the CRM when the user makes a reservation online;
- Store a CRM-generated Universally Unique Identifier (UUID) in the analytics tool; or
- Send a cookie and CRM-generated UUID to a unified database.
After that’s done, we bring all the data together. This is where the Windsor.ai pipelines and platform come in handy. Finally, we can answer the critical marketing questions, like:
- Which marketing campaigns bring in the most valuable customers?
- Which marketing campaigns bring in the most long-term customers?
- Do some marketing channels bring in lower-value customers?
- What other products could specific customers be interested in based on their browsing behaviour?
5 main steps to measure the impact of online advertising on offline revenues
Advertisers in industries with expensive products which are often bought offline, such as luxury products and cars, often face the following question by their management:
“Now that we are advertising digital and we can track customers, show me how these efforts pay off for the business.”
Now technically it is possible to measure and track the customers, but it’s often not done. Measuring the payoff, ROI, ROAS or CPA in an actionable way can unleash exponential growth in any organization, given of course the product being sold having the right product-market fit.
As a prerequisite, we strongly recommend having at least 6 months of data both on the spendings and the revenue side.
Get access to all your costs data
Extract all the data from all the places where you buy media and extract them on a breakdown by channel by day. If you advertise in multiple markets, it’s good to have the country as an additional dimension. Usually, the CPA by country varies greatly.
Here the source platforms will be Google, Facebook, Bing, Twitter, Linkedin, etc..

Get access to all your revenue data
Now we want to get access to all the revenue data across all channels where you have your revenues. Here it is again important to have the channel (e.g. offline store, e-commerce stores, retail partners, online store).
Here your source systems will be your CRM system where you track all revenues.
As for the spendings, the more granular the data, the better. It’s best to have daily data by offline revenue source. If you operate in multiple countries we strongly recommend to also have the data on a country level.
Note: This step often would require help from the finance team. It’s important to clearly explain to them what you do and get their buy-in.

Match your data on a daily, weekly and monthly level
Now depending on our technology stack, we take all the data and we put them into a database table or a simple Google Sheet or Microsoft Excel file.
Analyse your data
Now depending on our technology stack, we take all the data and we put them into a database table or a simple Google Sheet or Microsoft Excel file. The best way to look at the data is by creating a simple bubble chart with the following setup:
Series: All conversions you have through the chosen period
Entity: Week (or Day or Month, this will need experimentation on your end and depends on the product you are selling)
X-axis: Online Spending
Y-axis: Offline revenue
Bubble size: ROI
The results will be a bubble chart similar to what you see below:

Now you can start identifying trends and you should be able to see patterns which help you to investigate further.
Refine your analysis
Now update the bubble chart and specifically to (a) limit data to a period which is expected to have a common seasonal pattern (to reduce seasonality effects), and (b) adjust revenues using a price index, if it is available (which should take into account product mix and promotion events). We’ll cover more on the topic of building your media mix model soon.
Wrapping it up
To drive results you will need to
- Get access to all the data and merge it into one single place
- Understand your control variables (seasonality, price events, …)
- Take action on the insights and iterate
Last but not least, our platform helps clients to get insights as described above and makes sure the data stays fresh (no more CSV and Excel data wrangling).
Want to Boost the Performance of Marketing? Want to Connect the Online and Offline Customer Journeys, book a Free Demo of Windsor’s Marketing Attribution Software, to see how it helps you get the best out of your marketing activities. More information and our pricing can be found here.
You might also like to read:
Complete Guide to using Power BI for Digital Analyst
A B2B Marketing Attribution Guide for Advanced Marketers in 2023
What is Attribution in Digital Marketing?
Try Windsor.ai today
Access all your data from your favorite sources in one place.
Get started for free with a 30 - day trial.