

Marketing Analytics and Power BI go hand in hand now, no any self respecting agency can go on spending millions or billions on digital marketing without understanding the performance of their spending efforts.
To say that digital marketing is one of the fastest-growing industries would be an understatement. You must be aware of how fast the industry is growing – especially in the last few years. In the US alone, it was worth almost US$155.3 Billion in 2021. The annual compound growth is estimated to be 18.2% until 2028. Now you do the math!
It is no surprise that people are searching for the best tools for digital marketing, be that analysis, collecting data, data visualization, prospecting, all of the above, or something completely different. Power BI is a powerful digital marketing tool for data visualization. Here we’ll tell you how to connect it to your data sources and leverage its strengths better.
What are the advantages of Power BI for marketing analytics?
Perhaps we should first tell you that it is a Microsoft service for data visualization and business intelligence.
In short, Power BI allows you to create custom reports and data visualizations. Anyone who has ever created a report from scratch knows how difficult it is, even when you have all the data at hand. Power BI solves that problem, and these are its key functions which are also its key advantages.
Modeling
Businesses often use data that comes from various sources. If you are an omnichannel retailer, you can gather customer data both at the store and online. But even if you only sell online, you can collect data from different channels. That data needs to be integrated to make the most of it.
Modeling is the process of defining data structure, processes, and how that data is interconnected logically. The connection is called a ‘relationship’ in Power BI. In other words, modeling is the process of building models that’ll allow you to make the most of your data.
Visualization
Visualization is the next stage, and as the word suggests your data is presented visually. To be more specific, Power BI allows you to build visual models that will allow you to present your data to anyone. You can even embed the visual models on your site. There are different types of charts that are available in Power BI.
Try Windsor.ai today
Access all your data from your favorite sources in one place.
Get started for free with a 30 - day trial.
Use Cases for Power BI in Marketing Analytics
If all of the above sounds a bit abstract, we will give you a few examples of how you can use Power BI.
Measuring Paid and Organic marketing efforts
If you’re measuring paid and organic marketing efforts, you will likely use data from GA4. However, you can also compare your paid keywords with organic keywords and view the comparison as a model.
Social Media Monitoring & Analytics
Let’s say you’re using one or multiple social media platforms to market and present your product. You can use Power BI to better understand what your customers and the market think of your product. All that messy data scattered all across your social media pages can be presented neatly.
Keyword analysis
We mentioned keywords, but here we have to say that the real strength of Power BI is that you can do pretty much everything you want with it. Let’s say that you want to show the scope of the keywords that you’re ranking for. You can create such a chart in less than a few minutes.
How to connect Power BI for marketing analytics using Windsor.ai
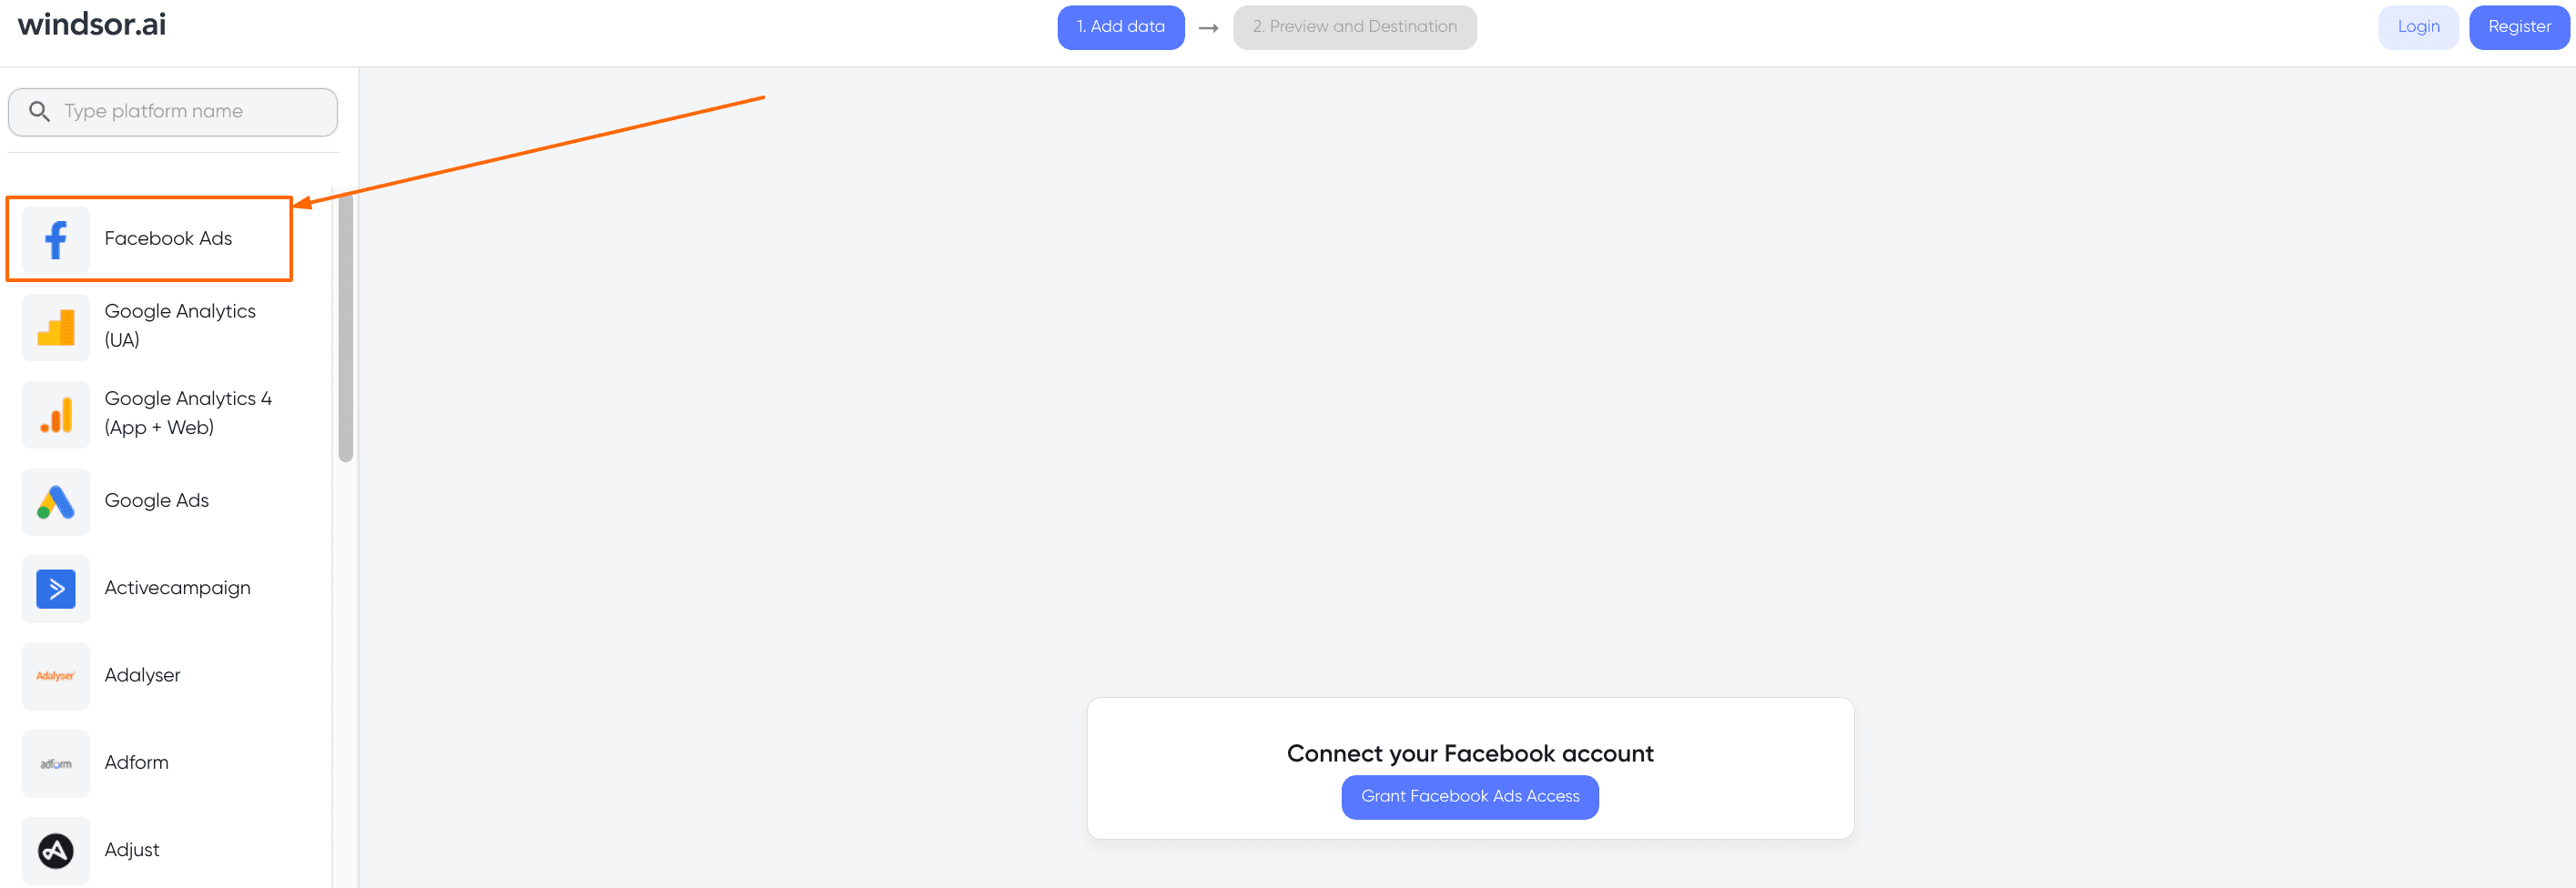
1. Okay, if you haven’t used Windsor.ai yet, you can start a free trial right away. Once you log in, you will need to choose your data sources.
2. There are plenty of options, but let’s say that you choose Facebook Ads, (GA4, Facebook Page, LinkedIn, Twitter Ads…). So, make sure you connect your data sources and grant access to Windsor.ai. Otherwise, it won’t be possible to use the service.
3. The next step is to select a data destination – Power BI in this case.
4. If you’re using multiple sources, it is best to choose blended data.

You can notice that on the right-hand side you can choose the metrics that you wish to include. In the Data Destinations area, you can select one of the two versions of Power BI – Desktop or Web. Copy the API key and then paste it once you log in to Power BI. If you don’t have a template, you can choose one from Microsoft AppSource.
And it’s as easy as that. Power BI is user-friendly, and many free sources on the net will enable you to make the most of it.
Power BI for Marketing Analysts
Templates are important in Power BI. A template is like an empty report that contains all of the structure, but none of the data, to prevent unauthorized access.
Then there are theme templates that allow you to use different colors and color combinations in Power BI. Finally, an example of a Power BI application that you can use later on with a different set of data is also a template. This last type of template is probably the type that you’d be using if you’re new to Power BI. You will be able to alter and improve your templates and benefit from your data.
Sign up today, start your free trial and allow Windsor.ai to connect your data seamlessly so you can create the best data models and visualizations in Power BI.
Windsor.ai Features
- 75+ data sources to 14 data destinations
- G2 Review score average 4.8 out of 5
- Forever Free Plan
- All connectors available on all plans
- SOC 2 Type 2 certified, supports single sign on and multi factor authentication
- Email and live chat support
- Database destination pricing independent of row count
Try Windsor.ai today
Access all your data from your favorite sources in one place.
Get started for free with a 30 - day trial.
You can watch this “How to visualize your marketing data in Power BI using WindsorAI” video to help you start.
You might also like to read:
Best Practice for Your Power BI Data Sources
Connect Facebook Ads to Power BI: Ultimate Guide
Load data from Google Ads to Power BI
The Benefits of Digital Marketing Attribution Modeling You’re Missing Out