
Analyze your Facebook Ads data with Google BigQuery
About Facebook Ads
About Google BigQuery
Why integrate Facebook Ads with BigQuery?
Google Big Query is a helpful data warehouse for online marketers to analyze Facebook Ads data. However, connecting the data from Facebook Ads to BigQuery can be complicated and might require costly technical engineering. Thankfully, with the Windsor.ai connector, it is possible to do it in a few clicks.
Facebook has become an excellent marketing channel for many businesses providing a great reach and targeting, thanks to nearly 2 billion daily active users on the platform. However, online advertisers prefer Google’s BigQuery over Facebook Ads Manager due to its features and ease of use, especially when handling several hundred accounts.
BigQuery allows other platforms’ data, including Facebook, to be integrated and stored in its data warehouses, making it easy to manage and analyze Facebook data.
Integrating Facebook Ads with BigQuery offers several advantages for businesses:
- BigQuery is a powerful data warehousing solution that allows you to store and analyze large volumes of data. By integrating Facebook Ads, you can store your advertising data in BigQuery for advanced analysis and reporting.
- BigQuery provides robust querying and data analysis capabilities. Integrating Facebook Ads allows you to perform complex queries, uncover insights, and generate custom reports based on your advertising data.
- You can enrich your Facebook Ads data by combining it with other datasets within BigQuery. This enables you to gain deeper insights by correlating advertising performance with other business metrics.
- If you’re running campaigns across multiple advertising platforms, integrating Facebook Ads data with BigQuery allows you to perform cross-platform analysis. This helps in understanding the overall impact of your advertising efforts.
- BigQuery supports real-time data streaming, allowing you to analyze incoming data from Facebook Ads in real time. This is valuable for monitoring campaign performance and making immediate adjustments.
Prepare your Facebook Ads data for Google BigQuery
Before we uncover the details of the methods to get your Facebook Ads data imported into BigQuery, it is important to prepare the data for the import. The data must be in the correct format, so there are no import issues.
In most cases, the data you pull from Facebook Ads Library API will be in an XML file incompatible with Google BigQuery. You will have to transform it to serialization understood by Google’s platform. Currently, BigQuery supports data in the following two formats:
- CSV
- JSON
Apart from the format, you will also need to ensure that BigQuery supports the type of data you leverage from Facebook. Currently, the following types of data are supported:
- INTEGER
- STRING
- FLOAT
- RECORD
- TIMESTAMP
- BOOLEAN
If you want to know more about the data conversion process and additional requirements, you can visit Google’s BigQuery Documentation page.
Once your data is successfully prepared in the correct format, it is time for the most important step – transferring the data into BigQuery.
3 methods to connect Facebook Ads to BigQuery
While there are a few methods to get the Facebook Ads data to BigQuery, the process is often complicated and costly.
Unfortunately, Google’s BigQuery does not have a simple and quick built-in tool to import data directly from the Facebook Ads Manager. However, you can still import all your Facebook ads data into BigQuery using any one of the following three steps.
Method 1: Using Windsor.ai connector integration to move data from Facebook Ads to BigQuery
One of the simplest and most reliable methods to import your Facebook Ads data into Google BigQuery is using a powerful connector integration from Windsor.ai. Compared to other methods, it is the easiest and does not require writing a single line of custom code.
Here is a step-wise guide to integrating your Facebook Ads data into your BigQuery using Windsor.ai:
- Sign up for Windsor.ai. You can also take advantage of the free trial to get a feel of the platform and see its features.
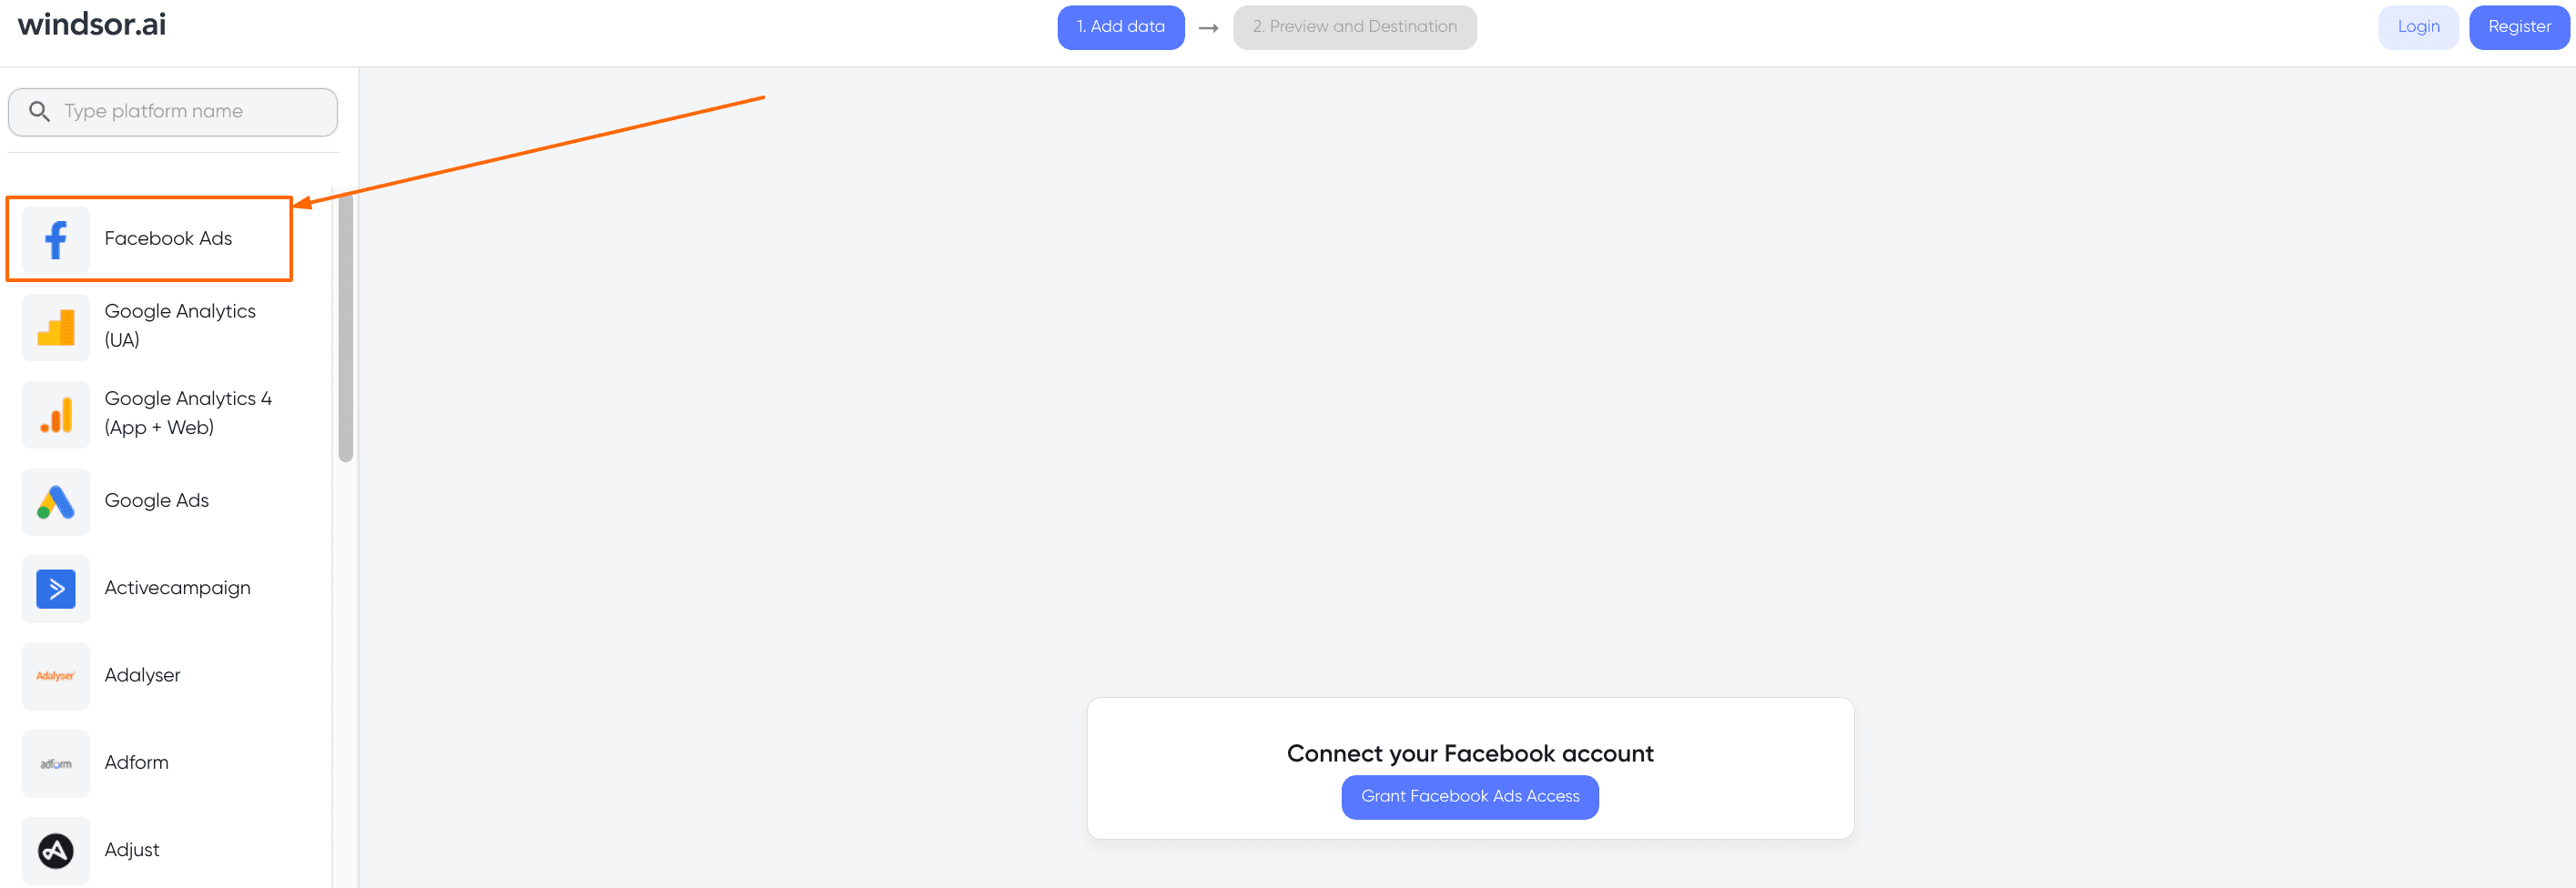
- Once in your account’s dashboard, select Facebook Ads in the left column as a data source. Once you choose Facebook Ads, you don’t need to download the raw data from your Facebook Ads Manager. Windsor will do that for you in the next step.
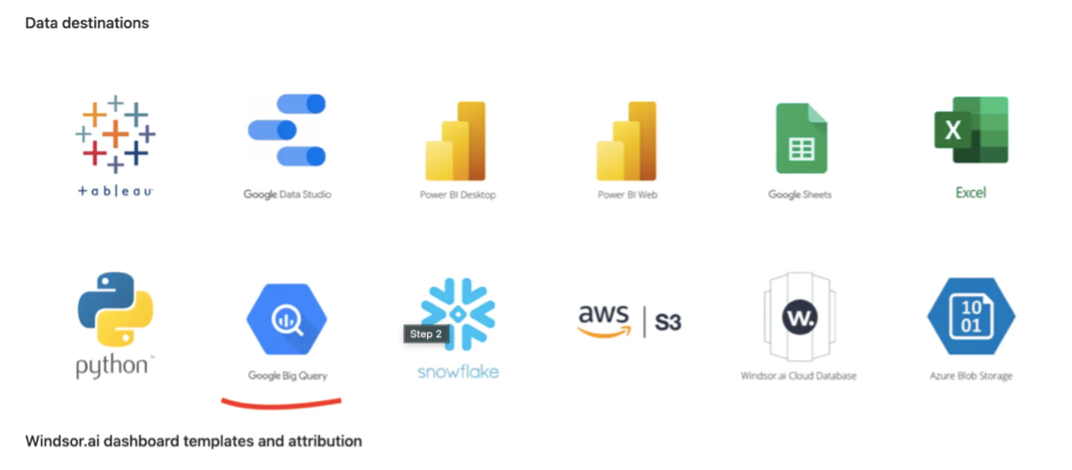
- Once you select the data source, click the Next (Data Preview Button). Here, on the next screen, you can choose multiple BigQuery competitors for your Facebook Ads data, including Google Sheets, Looker Studio, and of course, Google BigQuery.
- Select Google BigQuery by clicking on the logo, as shown in the screenshot below.
- On the next screen, click the API URL to show the connector URL.

- Clicking the API URL will open a dialogue box containing the URL of the connector. You need to copy it.
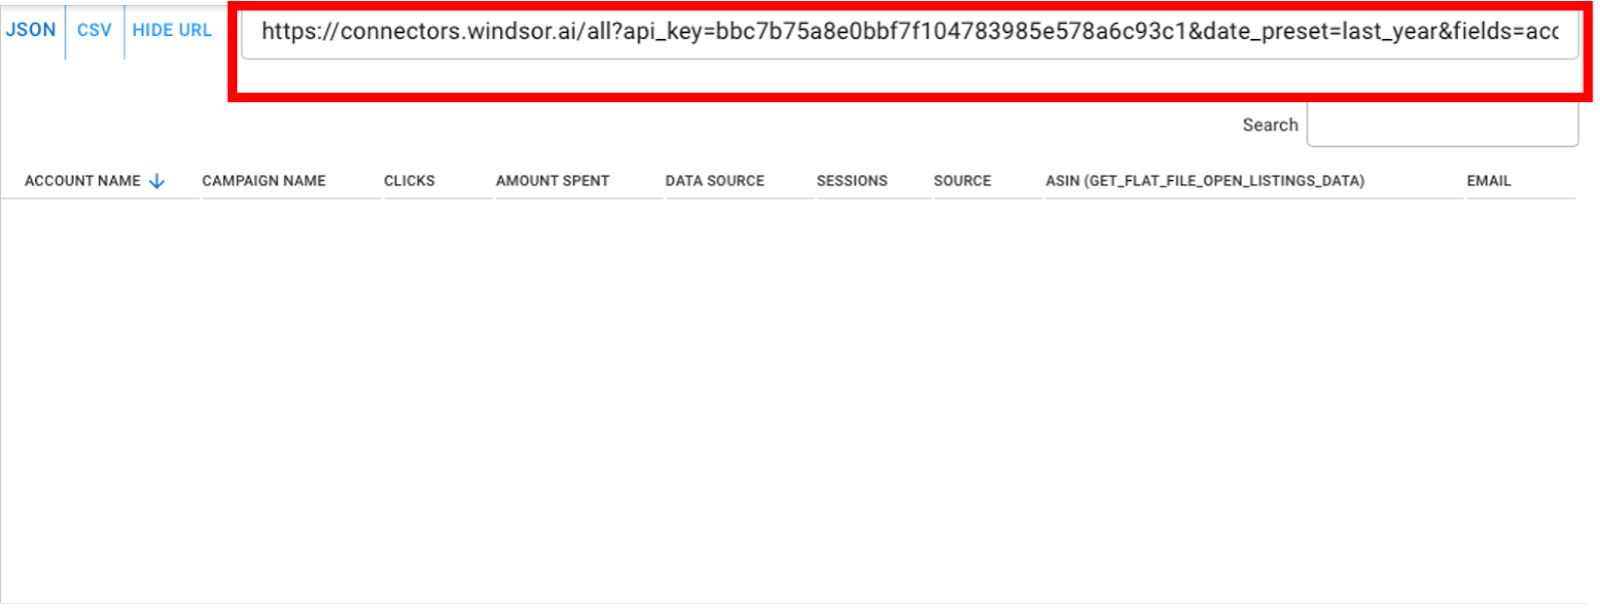

- In the final step, grant access to the user: bq-upload@windsor-ai-bigquery.iam.gserviceaccount.com and paste the connector URL you copied into BigQuery. That’s all!
- Once you go through these steps, you will see that the data is automatically populated into your BigQuery account.
As you can see, it is easy to analyze Facebook data with the BigQuery platform using the Windsor.ai connector. Sign up today for a 30-day free trial version or request a demo.
Try Windsor.ai today
Access all your data from your favorite sources in one place.
Get started for free with a 30 - day trial.
Method 2: Upload data manually from Facebook Ads to BigQuery
Uploading data manually from Facebook Ads Manager to Google BigQuery is tedious and time-consuming. Although it is the cheapest way, it will require several steps.
If you want to know how you can manually enter data from your Facebook Ads into your BigQuery account, follow the steps given below:
- Sign up for Google Cloud Project and create a new project for your campaign.
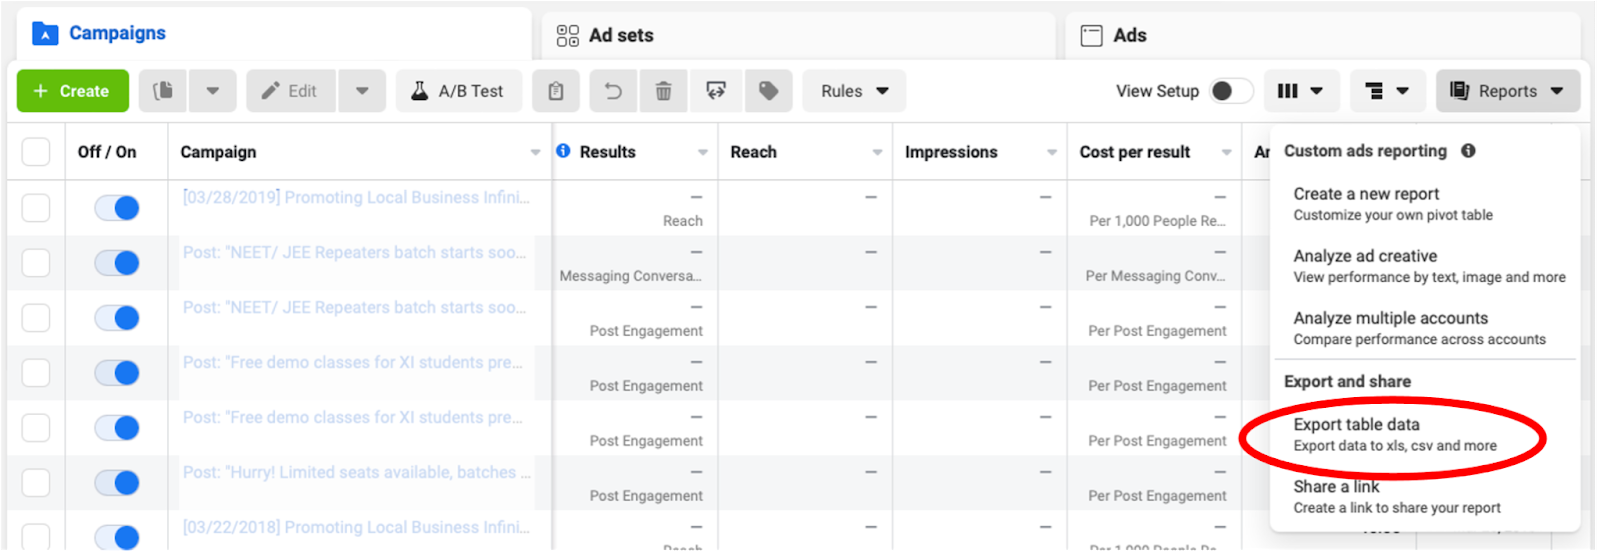
- Go to your Facebook Ads Manager, select the data you want to import and download the reports. Make sure that you save the files in the .csv format.

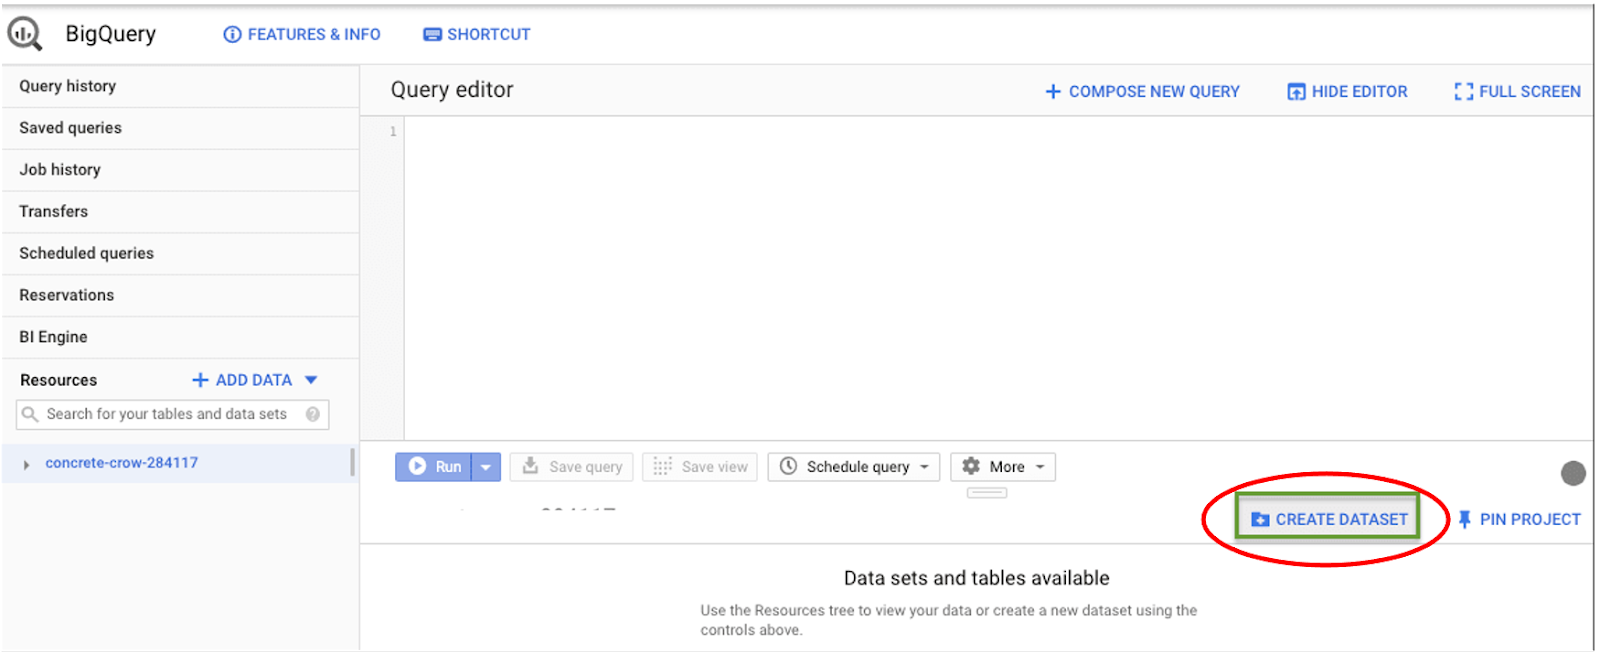
- Go back to the project on BigQuery and click “Create Dataset” and name it, ensure that it is encrypted and click “Create Table.”
- Then in the source section, create the table form and select the file format to .csv.
- Then navigate to the destination and select the correct options.
- Go to “Partition and Custer Settings” and choose the option that suits you the most, and select field delimiter by going into the “Advanced Options.”
- Click create a table. Once you do this, your data will be populated in BigQuery with Facebook Ads data.
- Once the data is populated, you can go back to Google BigQuery and click on your dataset ID.
- You have multiple options for your data. You can either write SQL queries against your Facebook data or export them to Looker Studio or other third-party tools for in-depth analysis.
- Just repeat this process to extract all the Facebook data from your campaigns and import it into BigQuery.
As you can see, this process is quite lengthy and time-consuming. Imagine doing this over and over for multiple Facebook accounts you handle. It can get tiring and difficult to analyze Facebook data of multiple accounts.
However, following these steps will help you get your Facebook data into your BigQuery account if you must do it.
Method 3: Writing custom scripts to move data from Facebook Ads to BigQuery
If you have a technical team or expertise in writing code, you can also write custom scripts to pull data from your Facebook Ads Manager into Google BigQuery. Transferring data using a custom script involves the following two steps:
- Extracting the data from Facebook, and
- Loading it into BigQuery
You can extract the relevant ads insight data from Facebook through APIs or real-time streams.
You can access Facebook’s API using different SDKs that the platform offers. The platform natively supports Python and PHP. Facebook marketing API is RESTful, and you can interact with several frameworks and languages.
You can access all your ads data through the Graph API. You can also request additional data for specific ads through Facebook Insights.
If the process seems a bit complicated, we have you covered. Let’s take an example to help simplify things a bit. If you want to extract all the ads data from any given account, you can do that by executing the following script through curl:
curl -F ‘level=campaign’ -F ‘fields=[]’ -F ‘access_token=<ACCESS_TOKEN>’ https://graph.facebook.com/v2.5/<CAMPAIGN_ID>/insights
curl -G -d ‘access_token=<ACCESS_TOKEN>’ https://graph.facebook.com/v2.5/1000002
curl -G -d ‘access_token=<ACCESS_TOKEN>’ https://graph.facebook.com/v2.5/1000002/insights
Once the script is ready, all the requested data will be returned into a .csv format, and you can access it through an access URL.
Another way of pulling data from Facebook is by creating a real-time data structure. You will need to subscribe to the real-time update to do this.
You can get a stream of real-time data from your database using the right structure. While Facebook Ads have a tremendously rich API, and you can extract even the smallest piece of data regarding your account and target audience, things can get complicated quickly.
You will need a more complex protocol to handle large amounts of data from multiple accounts.
The data you pulled from Facebook can come in several formats. However, if you want to use it in BigQuery, you must be mindful of the formats that BigQuery supports.
Once you extract the data from your Facebook Ads Manager, the next thing is to load it into Google BigQuery. There are a few ways of getting this done. Perhaps, the simplest one is through the console.
Another way to enter the extracted data from Facebook Ads to Google BigQuery is using JASON API. You can also use tools like curl to request HTTP POST requests to lead data. Here is a sample POST request to load data into BigQuery:
POST /upload/storage/v1/b/myBucket/o?uploadType=media&name= TEST HTTP/1.1 Host: www.googleapis.com Content-Type: application/text
Content-Length: number_of_bytes_in_file
Authorization: Bearer your_auth_token your Facebook Ads data
To automate the import process, you must write custom codes and send your Facebook Ads data to BigQuery You can use any one of the languages to write the script.
- Python
- Java
- PHP
- Go
While building a custom code for your data transfer to Google BigQuery might seem an attractive solution, the process has some serious drawbacks as well:
- You will need to maintain your custom code, which will require additional resources
- You will also have to set up a data validation system so that there is no data leakage
- The method we discussed above works for importing the data from Facebook ads. If you want to analyze Facebook data, you will need additional code on top of that.
How do you get Facebook data into BigQuery?
1. Getting the data from Facebook Ads Insights
Before you can get started here you will need to have a Facebook ID with access to a Facebook Ads account (for this example).
Facebook has a well documented Marketing API with SDK’s in PHP and Python. There is an active community building and maintaining SDK’s and wrappers for R (https://github.com/daroczig/fbRads), Java Script and many more.
But let’s do a simple example here to explain how to query data from the Graph API.
The following request queries your account with an attribution window of 7 day post view for the time range between the 19/06/2020 and the 25/06/2020 and provides the fields account id, ad id, campaign id and ad-set ID on an ad-set level:
https://graph.facebook.com/v5.0/act_<YOUR ACCOUNT-ID>/insights?action_attribution_windows=%5B%227d_view%22%2C%227d_click%22%5D&time_range=%7B'since'%3A'2020-06-19'%2C'until'%3A'2020-06-25'%7D&time_increment=3&fields=account_id%2Cad_id%2Ccampaign_id%2Cadset_id%2Cdate_start%2Cdate_stop%2Caction_values&access_token=<YOUR ACCESS TOKEN>&level=adset
To modify and create your own queries I recommend using Postman and start with pasting the link above.
If you refer to the marketing API link above you can start creating your own reports easily.
2. Pushing the data into BigQuery
Before you get started here you will need to have write access to BigQuery.
The easiest way to upload data to BigQuery is the HTTP POST method. You can refer to the BigQuery API documentation for more information about it.
To get started I recommend creating an own table for the Facebook Ads data in BigQuery and then uploading the data using a Cron job every 24hours or more often (depending on the data volume and how often you run your reports).
Important note here:
The refresh token from Facebook expires, so it’s good to check logs or schedule yourself a notification in case the token expires, as this will break the data loading.
Facebook Ads metrics and dimensions available for streaming into BigQuery
Extract Facebook Ads data to BigQuery with Windsor.ai
See the value and return on every marketing touchpoint

Providing 70+ marketing data streams, we make sure that all the data we integrate is fresh and accessible by marketers, whenever they want.

Spend less time on manual data loading and spreadsheets. Focus on delighting your customers.


