
This Power BI Facebook Ads Overview Report template helps you to visualise your Facebook Ads performance in Power BI in a few clicks.
Follow the steps outlined below to get your data connected.
Main steps to get started with Power BI Facebook Ads Report Template
The template is available both as
Power BI Web Template
- Connect your Facebook Ads Data to Windsor.ai
Register or login if you already have an account.
- Choose Facebook Ads from the left-side menu, then click on “Grant Facebook Access”, login with your Facebook account and grant the required privileges.
- Select at least one Facebook Ads account from the drop-down.
- Click on Preview and Destination, choose Power BI Web, then copy your API Key.
- Install the Power BI Web App
- Click on Connect your data

- Enter your API key which you got in Step 4

- On the next screen click on Sign In
- Your data should be loading now. Depending on your data size this may take a minute or two.


Power BI Desktop
- Connect your Facebook Ads Data to Windsor.ai
Register or login if you already have an account.
- Choose Facebook Ads from the left-side menu, then click on “Grant Facebook Access”, login with your Facebook account and grant the required privileges.
- Select at least one Facebook Ads account from the drop-down.
- Click on Preview and Destination, choose Power BI Web, then copy your API Key.
- Download the Desktop Template
Download Power BI Desktop Template: Facebook Ads Overview Report
- In the template on the start screen, paste your API Key from step 4 like here:

Important: You will need to change the fields to their types (e.g. date, decimals, whole numbers, …) to use them in aggregations (sums, averages, …) or date filters. For users in Europe and other countries where a comma is used for decimals please change the locale of the data to English.
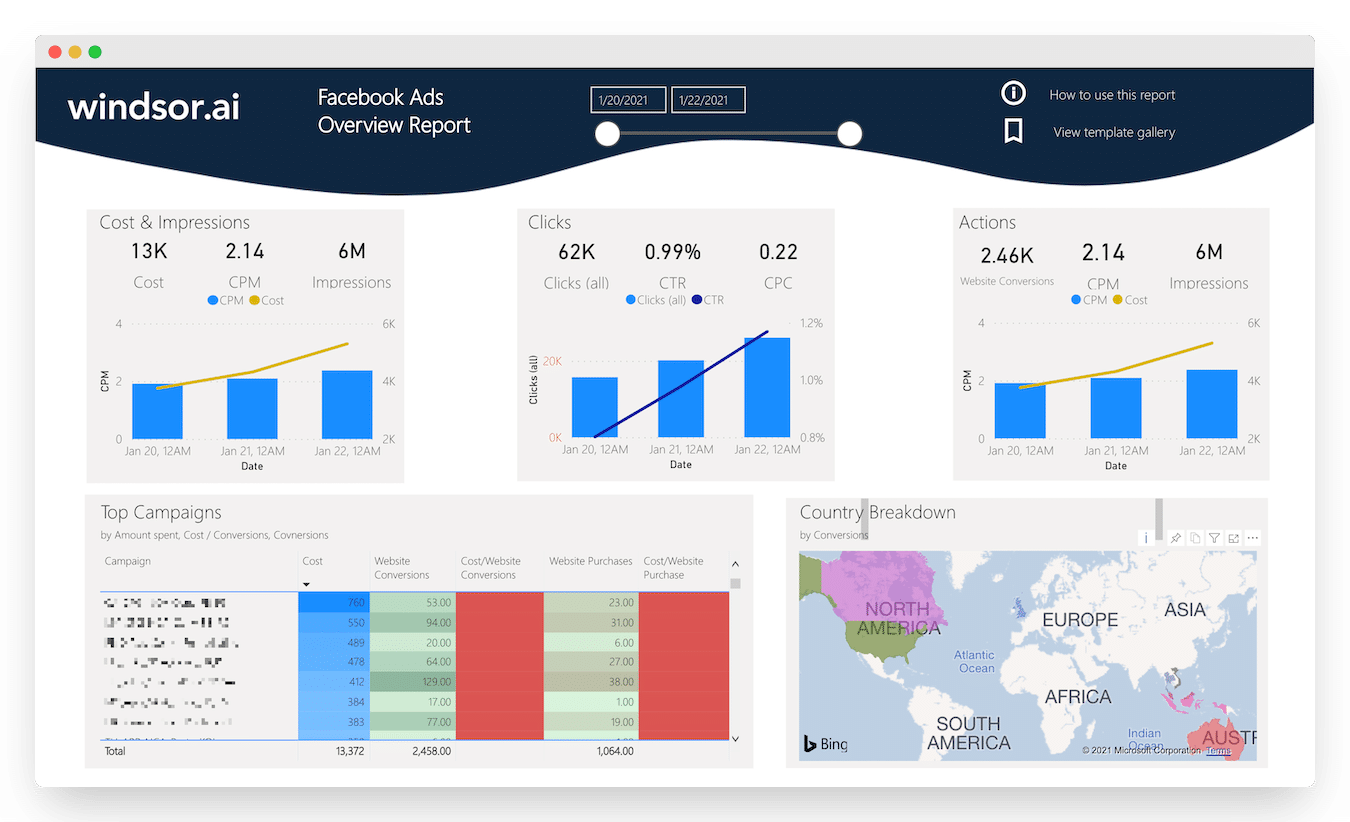
Power BI Facebook Ads Dashboard Template: metrics, dimensions and breakdowns
Dimensions
- Campaigns
- Ad set
Breakdowns
- Country
- Age
- Gender
- Objective
- Device
- Publisher (Facebook, Instagram, Audience Network, …)
Metrics
- Cost
- CPM
- Impressions
- Clicks (all)
- CTR
- CPC
- Website Conversions
- Website Purchases
- Website Purchase Revenue
- Cost per Website Conversion
- Actions (overall)
- Cost per Website Purchase
- Cost
Power BI Facebook Ads report template contains two pages.
Overview

Breakdowns

The Power BI Facebook Ads report dashboard template can be customised with > 500 different dimensions, breakdowns and metrics. Head here to see a complete list: available metrics and dimensions.
It queries the data through our connector and makes it available in real-time.
To get started with the Facebook Ads ROAS Power Bi Template
This .pibx template will let you explore the data once you connect your data and apply your API Key. If you are an advanced Power BI user, using this format, you can explore the data in more detail.
This Facebook Ads ROAS Power BI Report template helps you to visualize and understand your ROAS data. Dimensions and metrics visualized in this report are:
- Date
- Campaign
- Reach
- Clicks
- Impressions
- Spend
- Purchase Value and
- ROAS
Follow the steps outlined below to connect your data. In case you are interested in the Power BI desktop file used to create the report, simply scroll down further.
- Connect your Facebook Ads Data to Windsor.ai here. Register or login if you already have an account.

- Select at least one Facebook Ads account from the dropdown and remember to grant access
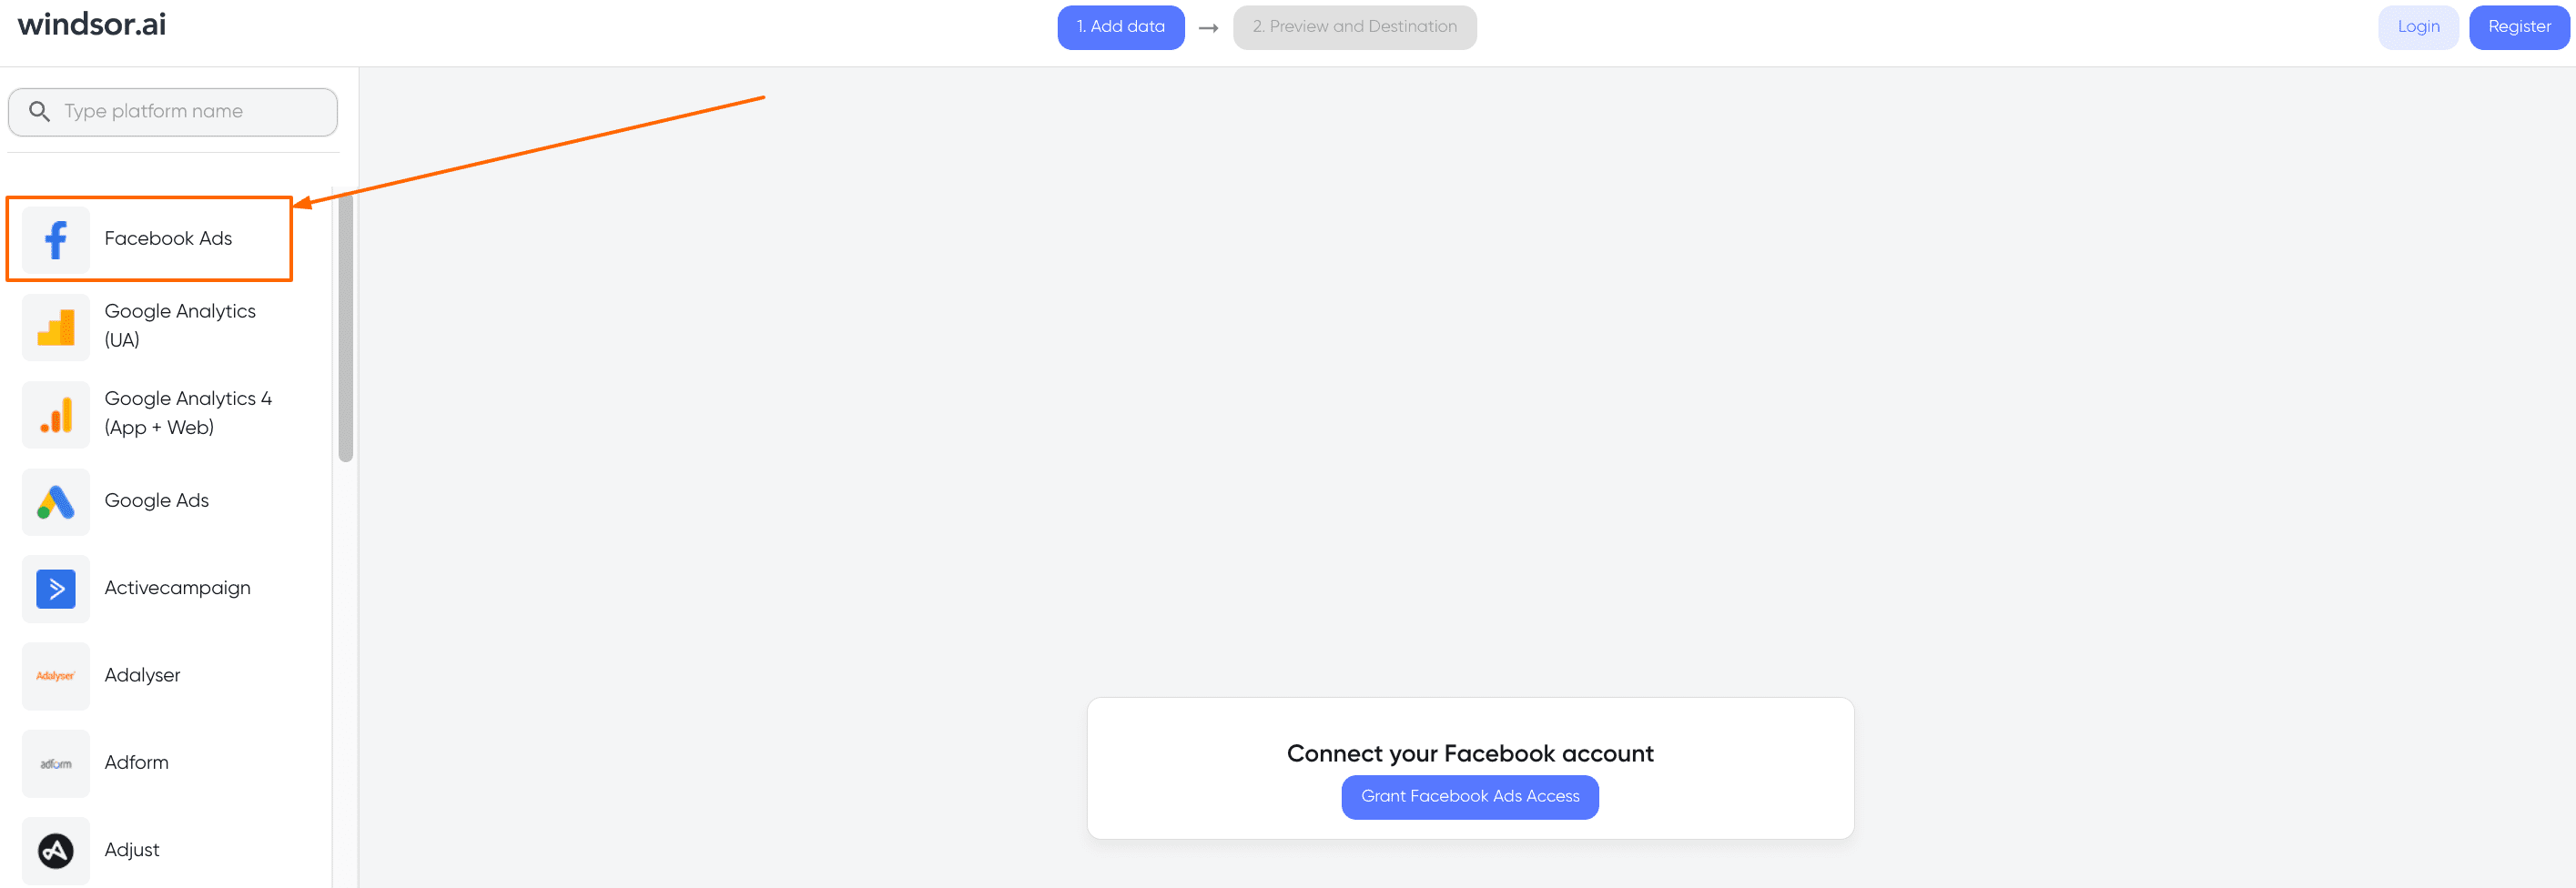
- Copy the API Key on the top right corner of the Onboard form page.
- Download the latest version of the dashboard template in .PBIX format here. Please note that the source data are in US regional settings format (1234.56 and 2020-12-16), and if you are using the different locale settings, you might need to transform numerical and date data. This will allow you to change the visuals and join the data with other data sets you might already have in your data setup.
- In the Facebook Ads ROAS Power BI template on the start screen, paste your API Key from step 3 like here


6. Start analyzing your data.
You might also be interested in…