 AI insights
 About us
 Careers
 Security
 Customer reviews
 Contact us
 Affiliate program
 Solution partners
 Looker Studio templates
 Tableau templates
 Facebook Ads templates
 Google Ads templates
 Data fields & Metrics
 AI prompt library & Guides
 Product documentation
 API documentation
 Case studies
 Blog
Blog Data models
 Windsor vs Supermetrics
 Windsor vs Fivetran
 Windsor vs Portermetrics
Free Tableau Dashboard Templates
Skip the hassle of building reports from scratch—our professionally designed Tableau templates let you visualize cross-channel marketing data instantly, with no coding required.
With seamless integration to over 325 data sources, Windsor.ai makes it effortless to connect your marketing and business data to Tableau. Whether you’re tracking campaign performance across Google Ads, Facebook, or other channels, our templates help you build insightful dashboards in minutes.
Each template comes with clear setup instructions, allowing you to focus on insights rather than complex preps and configurations.

Tableau Bing Ads Overview Dashboard Template


Tableau Compare Campaigns Performance Dashboard Template


Tableau Facebook Ads Report Dashboard Template

Tableau Facebook Page Insights Dashboard Template

Tableau Google Ads Dashboard Template

Tableau Google Ads Search Queries Dashboard Template

Tableau Google Analytics Dashboard Template


Tableau Google Search Console Dashboard Template

Tableau LinkedIn Ads Dashboard Template

Tableau Multichannel Attribution Dashboard Template

Tableau Stripe Dashboard Template

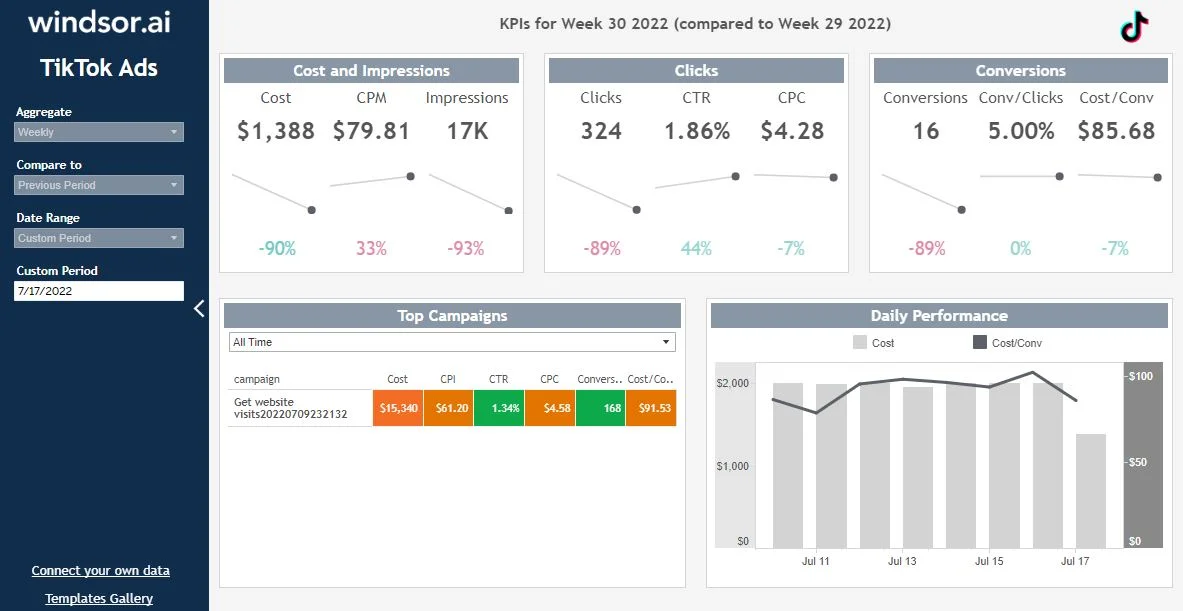
Tableau TikTok Ads Dashboard Template
How to set up Windsor.ai's Tableau templates
Select the template from the Windsor.ai gallery
On this page, select the template that best suits your data needs.

Connect a data source
In your Windsor.ai dashboard, connect the required data source and select the necessary accounts you want to pull data from.
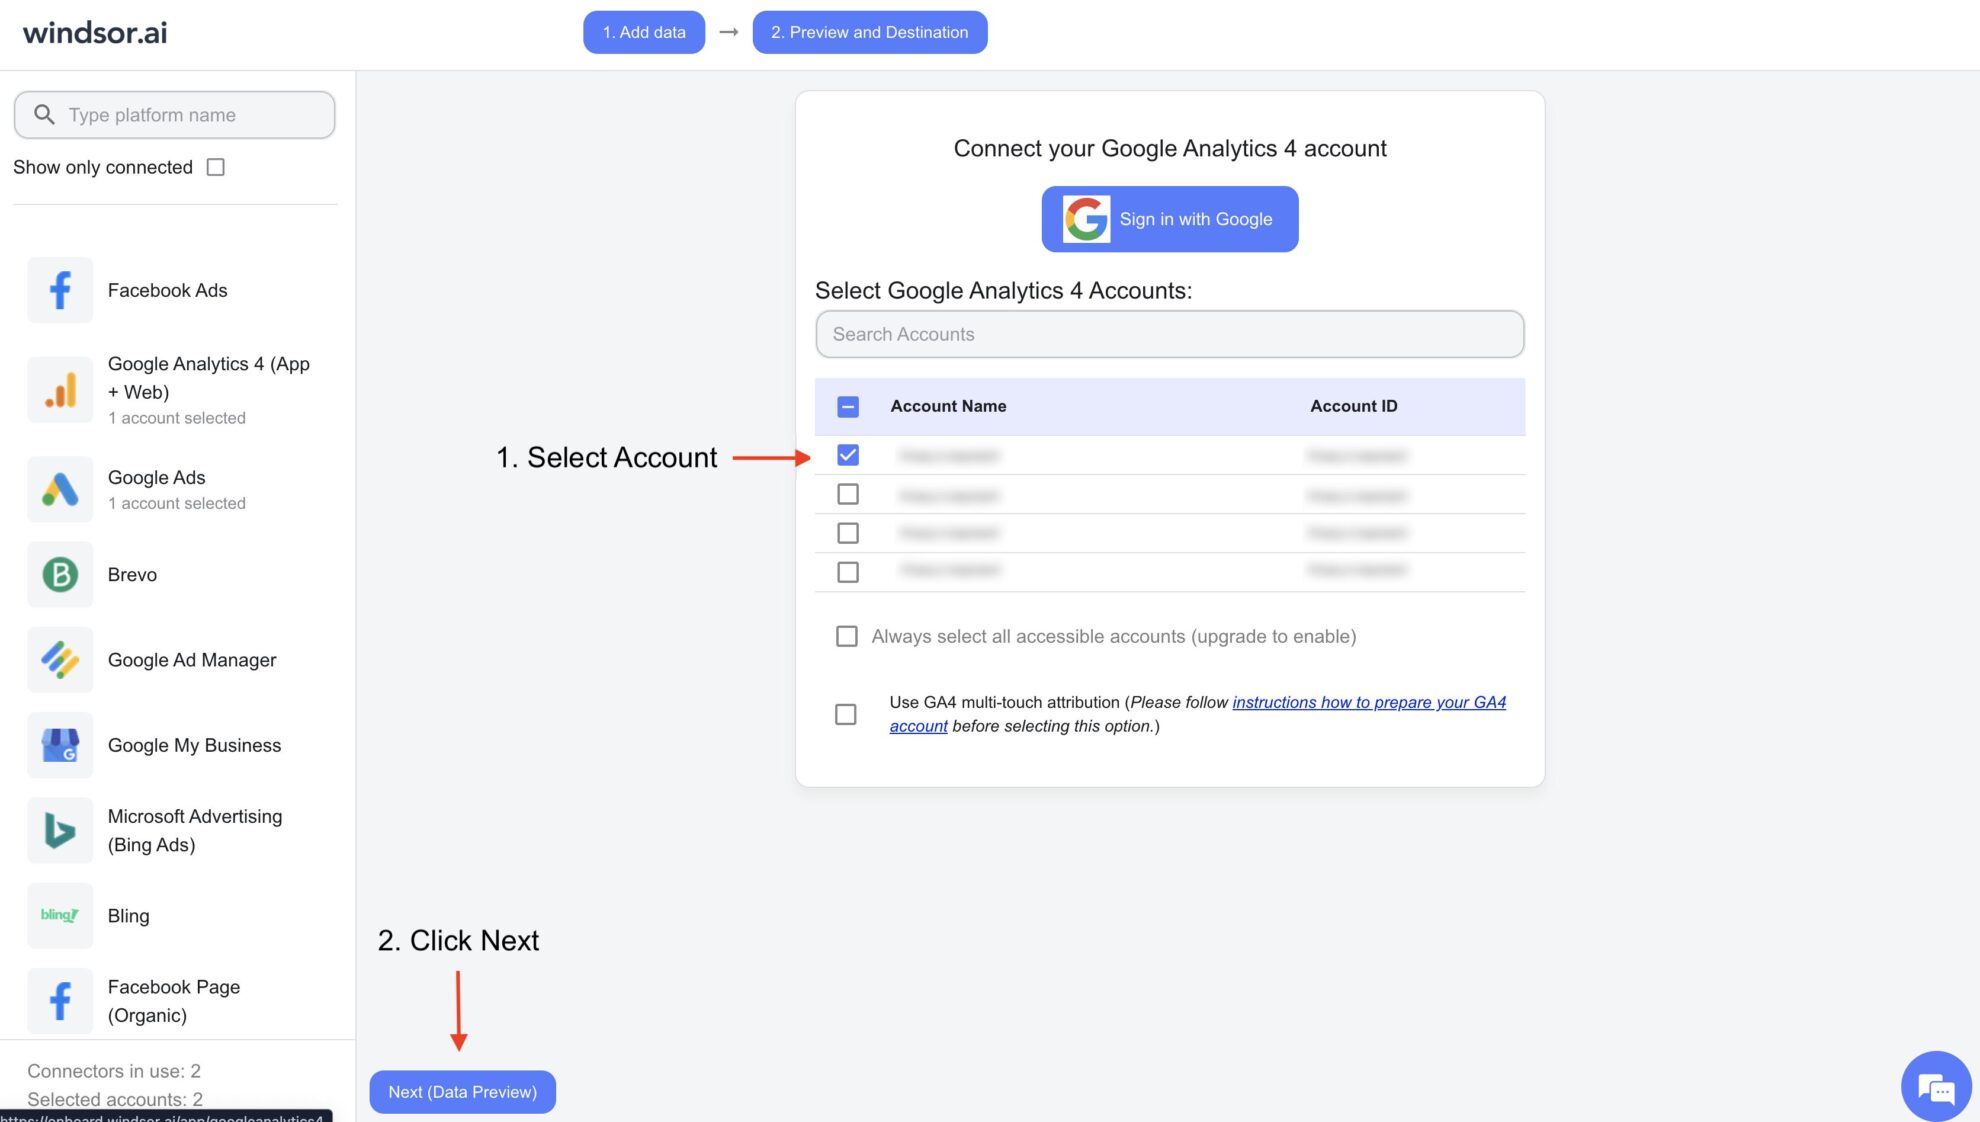
Connect the Tableau destination
Click on “Preview and Destination,” choose Tableau, and follow the integration instructions.

Install the template
Open the template page and follow the specific setup steps listed there to integrate your data from Windsor.ai into the Tableau template.

What is a Tableau marketing dashboard?
The Tableau marketing dashboard is a tool that visualizes key marketing data to help you gain important insights into ad performance, social media presence, email marketing efficiency, lead generation, and more. The findings are essential and guide you in making data-driven decisions that improve the overall performance across various marketing channels.
Marketing reports created through Windsor.ai’s Tableau dashboards are easily shareable; everyone within your organization can access them instantly. No advanced coding knowledge is required. You can also align workflows as needed and find answers to pressing questions, helping you gain a competitive edge.
Take your reporting to the next level with Tableau templates from Windsor.ai
The Tableau marketing templates help you visualize, analyze, and report various metrics of your data in comprehensive dashboards, empowering your teams with the following benefits:
Present crucial insights
Present crucial insights
Tableau templates offer a range of tools, including tables, charts, and maps, to help you effectively visualize data. This makes it easy for stakeholders to gain insights into various metrics and make informed decisions.

Integrate data from multiple sources
Integrate data from multiple sources
Unify data from various marketing platforms, CRMs, e-commerce sites, and business apps in a single dashboard for a holistic performance overview.

Get real-time updates
Get real-time updates
You can configure Tableau dashboards to be updated with the latest information from the linked data sources, ensuring that you make the most optimal decisions.

Scale to match your needs
Scale to match your needs
Tableau can comfortably expand as your data needs grow. As a result, the platform can effectively handle large and complex datasets, as well as generate responsive dashboards quickly.

Leverage customization options
Leverage customization options
With the assistance of Tableau report builder, you are able to generate, design, and publish custom reports adjusted to your brand guidelines and analytics goals.
Top 10 Tableau marketing dashboard templates from Windsor.ai
Discover the best marketing dashboard examples that you can access through the Windsor.ai template gallery:
- Social media dashboards: Present the performance metrics from social media accounts, highlighting data related to engagement rates, user demographics, and follower growth to develop more effective campaigns.
- SEO analytics dashboards: Showcase organic traffic, website performance, keyword rankings, and backlink profiles to determine the efficiency of your SEO strategy. You can later formulate innovative measures to enhance search visibility and increase traffic.
- PPC dashboards: Monitor indicators such as conversion rates, ROI, ad spend, impressions, and clicks to focus more on best-performing channels and find optimization solutions for underperforming ones.
- Sales dashboards: Follow relevant indicators (sales trends, sales distribution, product performance, leads) to gauge revenue growth, losses, etc. The insights may inspire the development of innovative sales strategies that drive growth.
- Content marketing dashboards: Get insights into content performance by visualizing conversion rates, traffic, leads generated, and engagement across different channels. Consequently, you can create better content that drives results.
- Email marketing dashboards: Bring enormous value to your business by displaying key metrics, such as subscriber growth, open rates, and click-through rates, using charts, graphs, or numerical data. You can discover what works and what doesn’t to optimize email content and targeting for improved conversions.
- Web analytics dashboards: Visualize website performance, highlighting user activity, conversion rates, traffic sources, and other metrics, to improve engagement and online presence.
- Lead generation dashboards: Assess metrics associated with lead acquisition by tracking data like lead sources, lead volume, and lead quality. This helps explore lead generation performance and improve the current strategies to increase revenue and conversions.
- E-commerce marketing dashboards: Get an overview of e-commerce operations through metrics like completed orders, total sales, number of sellers, and review score. Using this information, you can forecast demand and meet customer needs on time.
- KPI tracking dashboards: Visualize key indicators like customer satisfaction scores, revenue, and profit margins. With these insights, you can track progress toward achieving goals and identify areas that require improvement.

FAQs
What is Tableau used for?
Tableau enables users to perform numerous functions, including data visualization, analysis, reporting, integration, and storytelling.
What are Tableau templates?
Skip the hassle of manual setup—Windsor.ai provides ready-to-use Tableau dashboard templates that simplify your marketing reporting. Our professionally crafted dashboards let you dive straight into insights, minimize reporting errors, and focus on driving smarter decisions from your data.
Are Windsor.ai's Tableau templates free to use?
Yes, you can use any template from our gallery free of charge. The only fees might apply to data syncing using the Windsor.ai connector for automated data integration from a data source into Excel. Here are our pricing plans.
How much does Tableau cost?
With Tableau, you have different pricing packages depending on your desired deployment method and edition. Payable licenses are categorized into Tableau Creator, Tableau Explorer, and Tableau Viewer, with monthly costs of $75, $42, and $15, respectively. A free version is available for those who want to use the free Tableau templates before committing to any plan.
How to use Tableau?
Using Tableau is easy; you can kick-start the process by connecting it to a data source. The next step is to drag and drop fields onto the canvas to create visualizations. Then, find exciting data points and focus on specific results. Filters and colors can help you with this. Plot the data on a map, build a dashboard to display your insights, create a story, and share your findings.
How to share the Tableau report?
You have several options when it comes to sharing Tableau reports. One is to publish the report online or on a server and later share it by granting access to recipients. Another way is to generate a link to the report, embed it in web pages or emails, and share it with teammates. Alternatively, you can publish it publicly and share the URL provided online for everyone to view.
How to publish the Tableau dashboard?
Locate the toolbar and select the sharing option. Enter the recipients’ names and send. Users will receive a notification about the shared dashboard.
Power BI vs Tableau
Power BI is a Microsoft data visualization platform that easily integrates with multiple sources, helping users visualize their data through charts, graphs, tables, and more, for faster decision-making. Tableau excels at data exploration and storytelling, thanks to its drag-and-drop functionality and extensive visualization tools.
Tired of manual data exports into Tableau? Try Windsor.ai today to automate your reporting

