Marketing reporting can help you prove the worth of marketing. For example, if you can show how your campaigns are generating leads, bringing revenues, and fulfilling the business goals. Then you can prove the value of your and your departments and their efforts.
Marketing is the art of spreading information to attract new customers.
War is ninety percent information.
Napoleon Bonaparte, French Military and Political Leader
Measuring information is impacting sales is where marketing reporting comes into play. In this article, we’re going through the past, the present and the future of marketing reporting. We’re also going to share tools (updated as of 2023) and dashboards. But first let’s look at the definition of marketing reporting.
Table of contents
- What is marketing reporting?
- Who needs to create digital marketing reports?
- Why is Marketing Reporting Important?
- Marketing reporting basics
- Major steps to get the relevant data for your reports
- Marketing reporting software and tools
- How often should you create a marketing report?
- Who gets a marketing report?
- Types of marketing reports (by maturity)
- Marketing Attribution
- Main marketing reporting formats
- Conclusion
- Summary
What is marketing reporting?
Marketing reporting is defined as the process of measuring the progress towards meeting goals. It helps you to understand what actions to take and how your marketing effort is creating value.
We all know about the power of information and we all know that more and more money is going into marketing. Most buying decisions are now based (or if not, heavily influenced) on information which is found through a search. Gone are the days where a sales person is the first touchpoint with a brand.
The result: Increasing marketing budgets. As a result senior management, more than ever, want to understand the impact of spend to revenue.
Considerations while building marketing reports
Although you may feel like reporting everything, it is not a good idea. Because doing so, you may overwhelm your clients and stakeholders who are interested in just a handful of metrics like; leads for sales, branded search, conversion, etc.
To identify which metrics should you use, you must first figure out the objective and goals of your business and which metrics can best determine the ROI.
When building marketing reports, even if the metrics are similar, the individual channel source report may be different. For example, if you are making an SEO report, it won’t involve any information on ads and quality scores. Whereas; a PPC report will include it. An SEO and content marketing report can be similar in some ways as you are looking for organic keywords leading to clicks and conversion. An SEO report may include content information.
But a content marketing report may not include technical issues and individual keyword rankings.
Despite the differences in both the reports, it still shows the lessons learned, your plans, and how you want to address any issue.
Who needs to create digital marketing reports?
You’ve provided a comprehensive overview of who typically creates marketing reports in various contexts. Here’s a breakdown:
- Digital Marketing Agencies:
- Purpose: To update and inform clients about the performance of their advertising campaigns.
- Frequency: Usually sent out periodically (e.g., monthly) to provide regular updates.
- Internal Marketing Professionals:
- Purpose: To share performance data and insights with stakeholders within their organization.
- Audience: May include department heads, managers, and sometimes C-level executives.
- Freelance Marketers:
- Purpose: To update and inform clients about the progress and effectiveness of their digital marketing efforts.
- Frequency: Reports may be delivered on a weekly, bi-weekly, or monthly basis, depending on the preference of the marketer and the client.
It’s worth noting that the content and level of detail in these reports may vary depending on the specific goals and needs of each client or organization. Additionally, the reports may include a range of metrics, such as website traffic, conversion rates, click-through rates, return on investment (ROI), and other key performance indicators (KPIs) relevant to the specific marketing initiatives.
Try Windsor.ai today
Access all your data from your favorite sources in one place.
Get started for free with a 30 - day trial.
Why is Marketing Reporting Important?
Marketing reports can confirm your attempts and spots the successes of your work. They can spot the trends, as well as reach out even the smallest details and define how they add to your marketing ROI (return on investment). Marketing reporting assists you to build a frame of reference that revolves around data.
Reporting in digital marketing serves several crucial functions:
- Insight into Activities and Performance
- It provides a clear view of the marketing team or agency’s activities and how they are performing. This allows for an evaluation of the effectiveness of different strategies and tactics.
- Justification of Decisions
- It enables the justification of decisions regarding marketing activities. This includes decisions to allocate resources to specific campaigns, platforms, or target audiences, or even to discontinue certain activities.
- Preparation for Future Strategies
- Reporting helps in preparing stakeholders for upcoming strategies and tactics. It sets expectations and aligns all parties on the goals and plans for the coming period.
- Justification of Investment
- It plays a critical role in justifying the investment made in marketing. Advertisers monitor KPIs like ROI and ROAS to assess the effectiveness of their advertising spend. This data is crucial for demonstrating the value generated from the marketing investment.
- Relevance to Company Size
- The importance of reporting is not solely dependent on the amount of money spent on marketing. Even for smaller businesses with limited budgets, marketing reporting is essential. It helps them understand how their resources are being utilized and what results they are achieving relative to their investment.
In summary, regardless of the size of the marketing budget, reporting is a fundamental aspect of digital marketing. It provides transparency, accountability, and evidence of the impact of marketing efforts.
Marketing reporting basics
After we understand why should we create marketing reports, the thing we should be concerned about is, what constitutes a marketing report? The report can be of any type and look anyway. The thing that matters to you in the report may not be equally important to another person.
Hence a few sections of a marketing report are broken down and discussed below.
Summary
This section gives you an overall view and breaks down the major points like challenges, successes, and future goals.
Traffic metrics
This section reveals the source of traffic, which is divided by channel and device.
Engagement metrics
This section shows how much interest is a person to your site when they have visited it. Bounce rate, time spent on site, and frequency of visit are a few key points.
Business impact metrics
This is what proves the ultimate marketing success and includes things like the revenue, opportunities, and pipeline generated.
Major steps to get the relevant data for your reports
Building a marketing reporting dashboard is necessary for every marketer. No matter what system you are using to track down your business data. A dashboard helps you get a quick view of the metrics; that you think are valuable to you and your stakeholders.
When you are building a dashboard, you must have a clear view of your goals and then determine the performance of your campaigns over time. Besides, you must focus on a single topic and avoid having too many metrics, which helps a viewer to scan and get a quick understanding of the dashboard. Including too many metrics can make it complicated for the user to understand.
The overall creation of a dashboard is straightforward. Also, it works the same way in all systems. All that you need to do is, determine your business objectives and targeted audience, and then decide the marketing KPIs that you want to add.
- Ask the prominent and relevant questions
- Acquiring the highest possible data quality
- Breaking down silos and Depository
- Interpreting your data to get the best impression
- Combine the real-time data
- Bringing it all together
A contemporary report reveals that very few companies have fully implemented data systems. As data volumes continue to increase, integrated marketing analytics is very much important to getting the maximum out of your datasets.
Marketing reporting software and tools
If you ask ten different marketers what their favorite marketing tools are, you are bound to hear ten different replies. Most individuals utilize spreadsheet-based tools like Looker Studio, Excel, and Google Sheets, as well as BI applications like Tableau, Qlik, and PowerBI, to create reports.
The tool you choose will be largely determined by your budget and requirements. Looker Studio is a wonderful free alternative to traditional paid reporting solutions for most businesses. This one’s main selling feature is that it’s completely free. While there is a learning curve, you can rapidly conquer it by using one of the many free Google tools or by trial and error.

Try Windsor.ai today
Access all your data from your favorite sources in one place.
Get started for free with a 30 - day trial.
How often should you create a marketing report?
But, for the most part, here are the most common marketing report types as well as the specific reports you would share during a specified time range:
- Daily marketing reports
- Weekly marketing reports
- Monthly marketing reports
- Quarterly marketing reports
- Annual marketing reports
Daily marketing reports
By conducting daily marketing reports, teams can stay vigilant and responsive to changes in performance metrics, ensuring that marketing efforts remain effective and aligned with the overall strategy. This level of real-time monitoring is crucial for maximizing the impact of marketing activities.
Here’s a breakdown of the key sections and suggested KPIs:
1. Paid Ad Platforms:
- Click-Through Rate (CTR): Measures the effectiveness of ad copy and design in encouraging users to click through to your website.
- Cost Per Click (CPC): Reflects the average cost you pay each time a user clicks on your ad.
- Conversion Rate: Tracks the percentage of users who take a desired action after clicking on an ad (e.g., making a purchase, filling out a form).
- Return on Ad Spend (ROAS): Calculates the revenue generated for every dollar spent on advertising.
- Ad Impressions: Indicates how many times your ad has been viewed.
2. Engagement on Social Media:
- Likes, Comments, Shares: Measures user engagement with your social media posts.
- Click-Through Rate (CTR): Tracks the percentage of users who click on a link within your social media post.
- Follower Growth: Indicates the increase in your social media following.
- Engagement Rate: Calculates the percentage of your followers who engaged with your content.
3. Website Traffic:
- Sessions: Provides the total number of visits to your website.
- Pageviews: Indicates how many pages were viewed by users.
- Bounce Rate: Measures the percentage of users who leave your website after viewing only one page.
- New vs. Returning Visitors: Helps in understanding the composition of your website audience.
4. Conversion Rate:
- Overall Conversion Rate: Calculates the percentage of users who complete a desired action (e.g., making a purchase, filling out a form).
- Goal-Specific Conversion Rates: Focus on specific goals such as lead generation, sales, or sign-ups.
- Abandoned Cart Rate (if applicable): Indicates the percentage of users who add items to their cart but do not complete the purchase.
Consider using daily report templates that collects the most up-to-date analytics.
Weekly marketing reports
We’ve provided an excellent summary of the purpose and focus of weekly marketing reports:
- Weekly marketing reports serve as a regular status check for the progress of marketing goals and campaigns. This allows for timely adjustments and optimizations.
- These reports provide insights on a medium-term basis, offering a snapshot of performance trends over a week. This frequency enables marketers to make timely adjustments to their strategies.
- The primary aim of weekly reports is to generate actionable insights. This means that the data presented should lead to specific steps or changes in marketing tactics.
- In weekly reports, key metrics to focus on typically revolve around traffic and user engagements. This includes metrics related to website visits, page views, click-through rates, social media interactions, and similar indicators.
By monitoring these metrics on a weekly basis, marketers can quickly identify patterns, spot anomalies, and respond promptly to optimize ongoing campaigns. This proactive approach is essential for maximizing the effectiveness of marketing efforts in real-time.
Montly marketing reports
We’ve highlighted the key aspects of monthly marketing reports:
- Monthly marketing reports serve as a crucial tool for marketers and agencies to communicate and demonstrate the effectiveness of their marketing efforts to stakeholders.
- These reports are generated on a monthly basis, providing a regular and consistent update on the performance of marketing activities.
- Web analytics metrics are a central component of these reports. This includes data related to website traffic, user behavior, conversions, and other performance indicators.
- The report delves into the performance of specific marketing campaigns. This may encompass various digital channels like social media, email marketing, pay-per-click advertising, SEO, and more.
By combining web analytics and campaign performance data in a monthly report, marketers and agencies can offer a comprehensive view of how their strategies are influencing user behavior, engagement, and ultimately, business outcomes.
Quarterly marketing reports
Marketing reports are generated on a quarterly basis to record the performance of marketing efforts over a three-month period. These reports provide a broader perspective on average performance levels due to the extended time frame they cover. Senior leadership and stakeholders utilize them to identify medium to long-term trends and make projections about performance.
These quarterly marketing reports can encompass:
- Click-through rates for online advertisements, media and email campaigns.
- Thorough SEO reports that track keyword and page rankings, as well as the progress of both organic and paid campaigns over time.
- Reports on business growth, which may encompass expansions in subscriber base, revenue, and profit.
Annual marketing reports
The Annual Marketing Report serves as a vital tool for reflecting on the past year’s efforts, understanding what worked and what didn’t, and setting the stage for informed strategies in the coming year. It plays a crucial role in demonstrating the value and impact of the marketing team’s work to both internal stakeholders and clients.
The Annual Marketing Report serves the following purposes:
- Provides a comprehensive overview of key milestones and performance indicators achieved over the course of a year.
- Helps in identifying and highlighting major successes attained during the year.
- Enables a thorough evaluation of areas that could be enhanced or optimized for future strategies.
- Facilitates effective communication of the marketing team’s achievements and insights to both internal team members and clients.
Who gets a marketing report?
There are two specific groups that particularly benefit from the information presented in the marketing report:
1. Sales
The sales team benefits from the data in the marketing report in several ways:
- Understanding the volume of incoming leads
- Being aware of real-time trends in lead flow
- Knowing what to anticipate and how to adapt to changes
- Identifying which messages, features, or products are generating the highest level of interest
Ideally, the sales department leverages the data from the marketing report to align their pitch with the marketing message that successfully attracts leads.
Marketing data provides crucial insights from the top of the sales funnel. Marketing initiatives attract potential prospects and leads, some of which eventually convert into Sales Qualified Leads (SQLs) for the sales team.
2. Executives
Key stakeholders gain insight into the business’s trajectory from the information presented in the marketing report. It serves as a snapshot of the business, allowing them to evaluate performance by examining the numbers of incoming leads and customers.
Executives may not place as much emphasis on metrics like clicks, blog reads, or Cost Per Acquisition (CPA) as the marketing department does. When they are involved in the presentation of the marketing report, it is crucial to focus on financial figures as closely as possible.
Types of marketing reports (by maturity)
For the sake of convenience, let us group marketing reports into main types:
1. General marketing report
2. SEO marketing report
3. PPC marketing report
4. Social media marketing report
5. Content marketing report
6. Ecommerce marketing report
7. Web Analytics Report
8. Email marketing report
9. Multi-channel performance marketing report
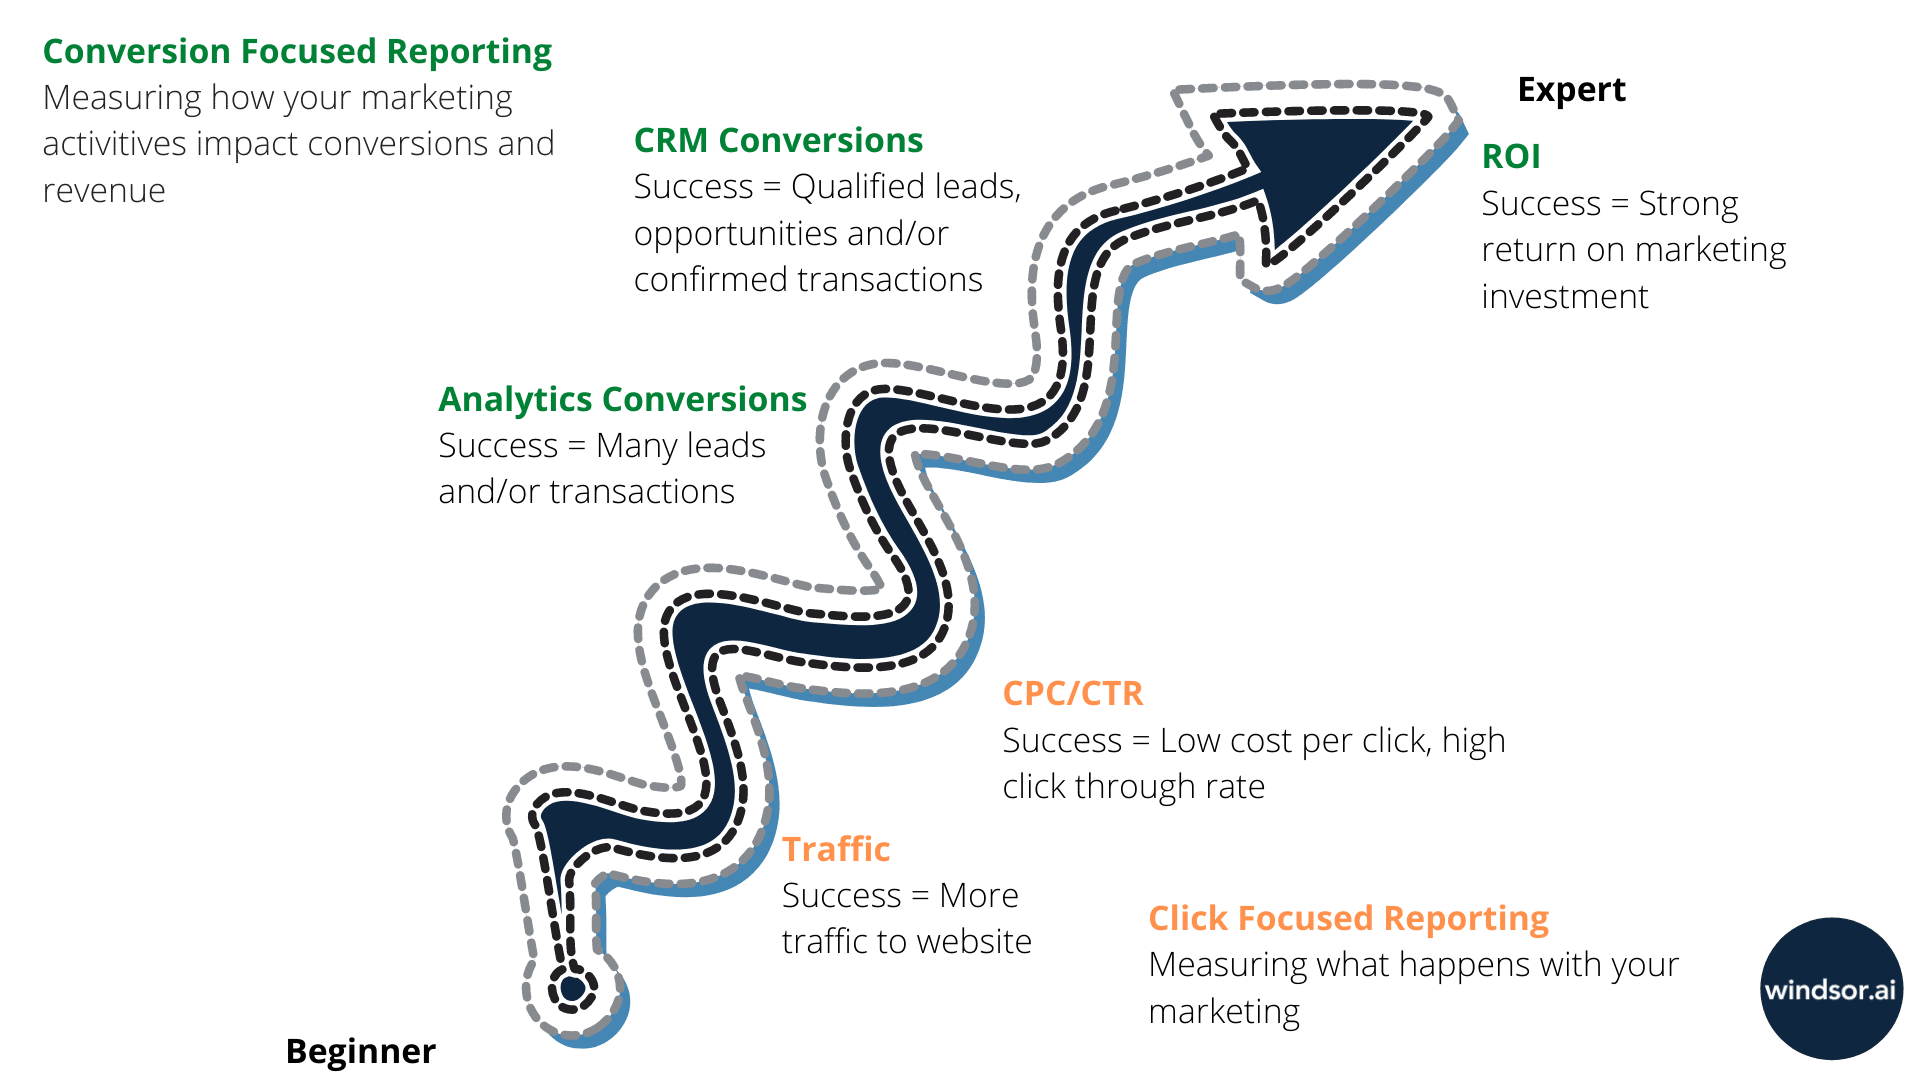
I’m not going to dive too much into the metrics, instead let’s have a look at it from a maturity perspective. In the chart below you can find 5 categories:
- Traffic
- CPC/CTR
- Analytics Conversions
- CRM Conversions
- ROI
Now let’s dive into them one by one, going from beginner to expert.
Certain marketers optimize outcomes based on traffic to the website, their outcome is what the title suggests:
Traffic
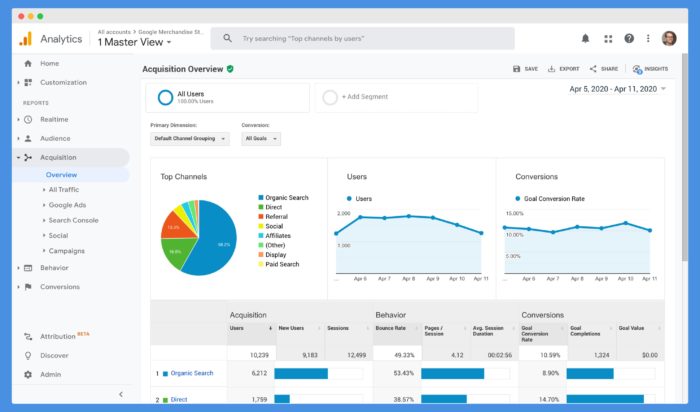
To get a marketing report based on traffic from your various sources do the following:
Open your Analytics platform and go to the acquisition section as in the screenshot below.
For a more elegant-looking report with the same data set you can use Looker Studio. This makes it easy for you to present data to your clients or your manager. Here is a template:
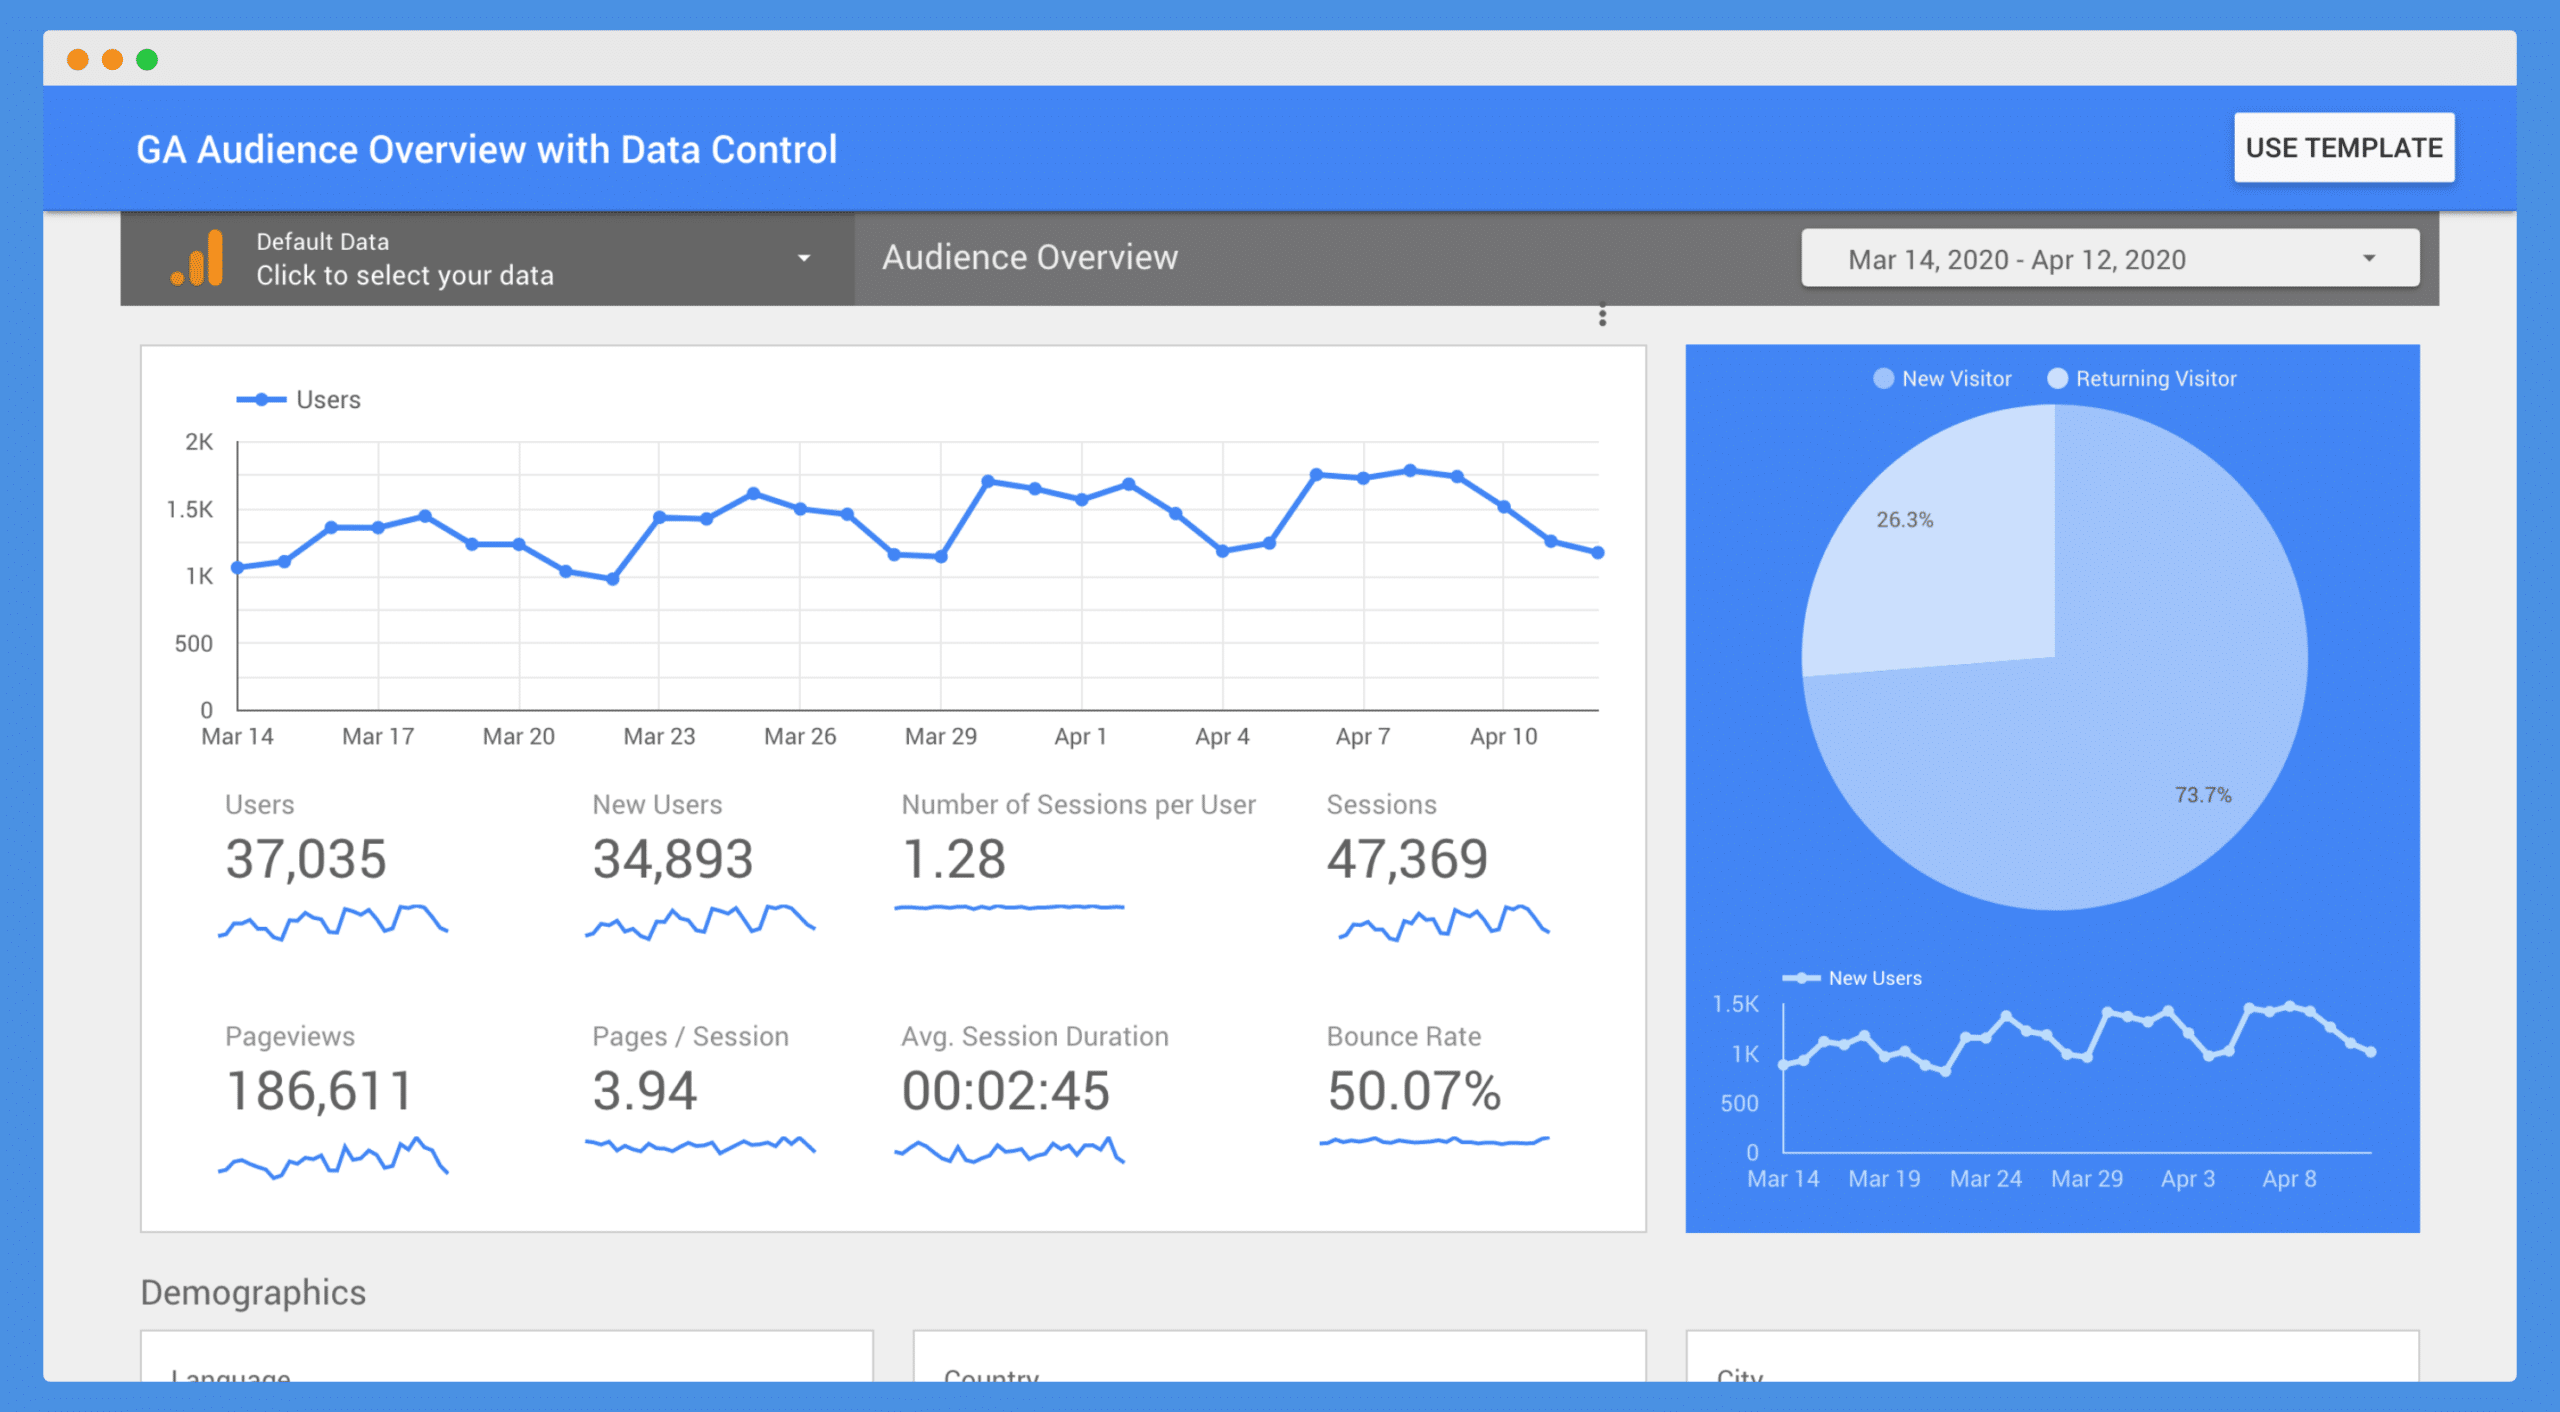
Traffic reports will give you an understanding on how you get potential buyers to your website. Important: It does not look into any other metrics. While it can be helpful you should not only look at traffic. Especially if you have a media buy it’s important to look at these metrics combined with costs. Let’s have a look at how we can do this in the next marketing report.
CPC/CTR
CPC stands for cost per click, CTR stand for click-through-rate. Marketing reporting on CPC/CTR connect:
- Web analytics (Google Analytics 4, Adobe Analytics)
- Costs data from the advertising platforms (Google Ads, Bing Ads, Facebook Ads, …)
This report, same as a traffic report, focuses on clicks but has the advantage of adding on the costs per click. The click through rate is a good way to check if your content wins over the customer to click on your link. In SEO this is a good way of measuring how your SERP (search engine results page) content appeals to the searcher. In paid advertising CTR’s are also important bu there is a lack of direct correlation between clicks and business actions.
As with the traffic dashboards you can find all Google related data in Google Analytics. The report below contains conversions and CPA’s which we’ll get to later.
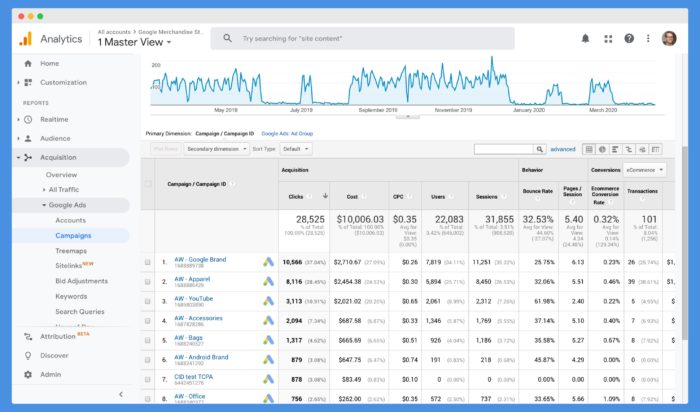
CPC and CTR report Google Analytics
As with traffic reports, Looker Studio offers templates for all Google related costs.
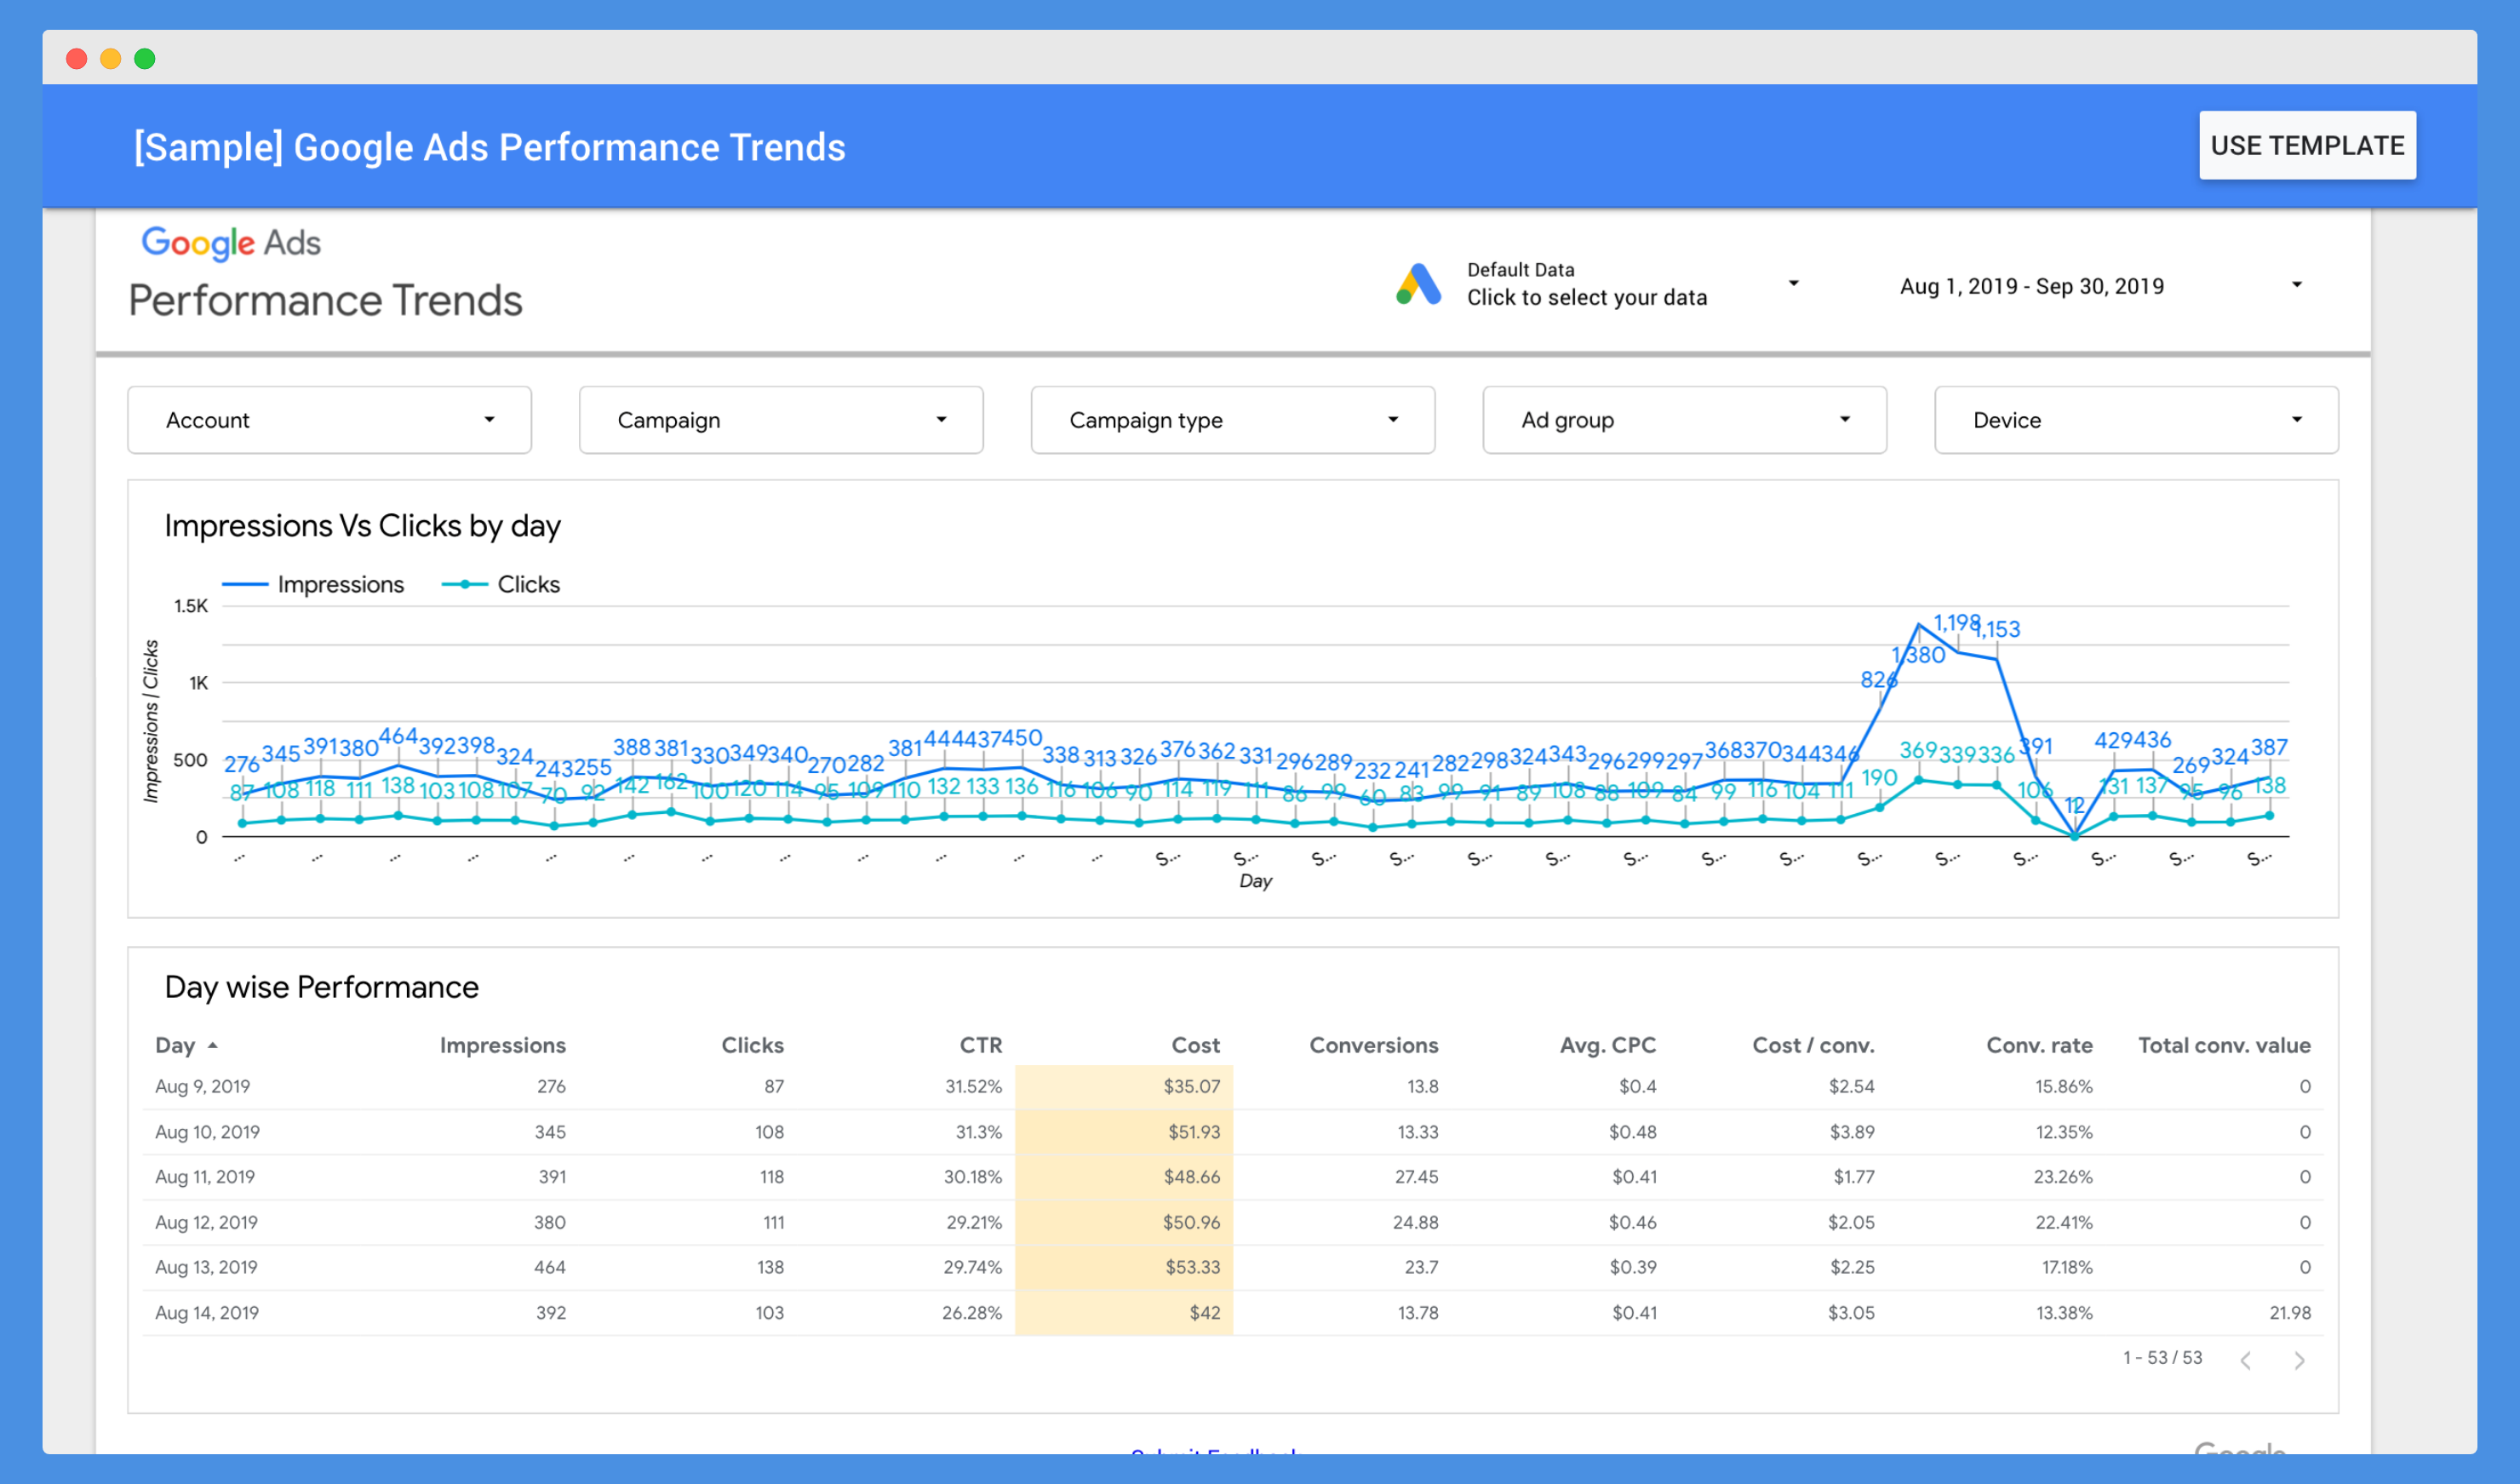
CPC report Looker Studio
To connect other costs like Bing or Facebook costs you can use the manual CSV upload functionality.
There are also tools to automate the connection of the data, more about this here. This should help you to get all marketing data into one place. Let’s move on to metrics which will impress your client or management more than reporting on clicks and CTR’s.
Analytics conversions
Here is where it starts to get interesting. The reports we looked at so far were based on outcomes (clicks or sessions) which do not correlate with business impact. The quote
Not everything that can be counted counts, and not everything that counts can be counted.
Albert Einstein, Physicist
Fits this perfectly. As you have noted by now on all the reports there are a lot of different metrics and dimensions to choose from. It’s important to measure what matters.
Conversion based marketing reporting means that your goal are leads or sales. There are two possible conversion types here:
- Ecommerce transactions: You sell something online and you have a direct conversion value. In this case it makes sense to skip this section and move to the ROI section.
- Lead capturing: Your goal is to get as many leads, form fills, event subscriptions, etc. as possible. The final outcome is a persons email address and/or details.
Cost/Conversions
As with the CPC/CTR dashboard Google Analytics provides you simple overview for anything Google related. In case you only advertise on Google channels, please refer to the dashboards I linked in CPC/CTR. Chances are that if you are reading this you will have extra media channels you want to report on. Here is a Looker Studio multichannel CPA Dashboard Template. You might need to change the channel mix according to your setup.
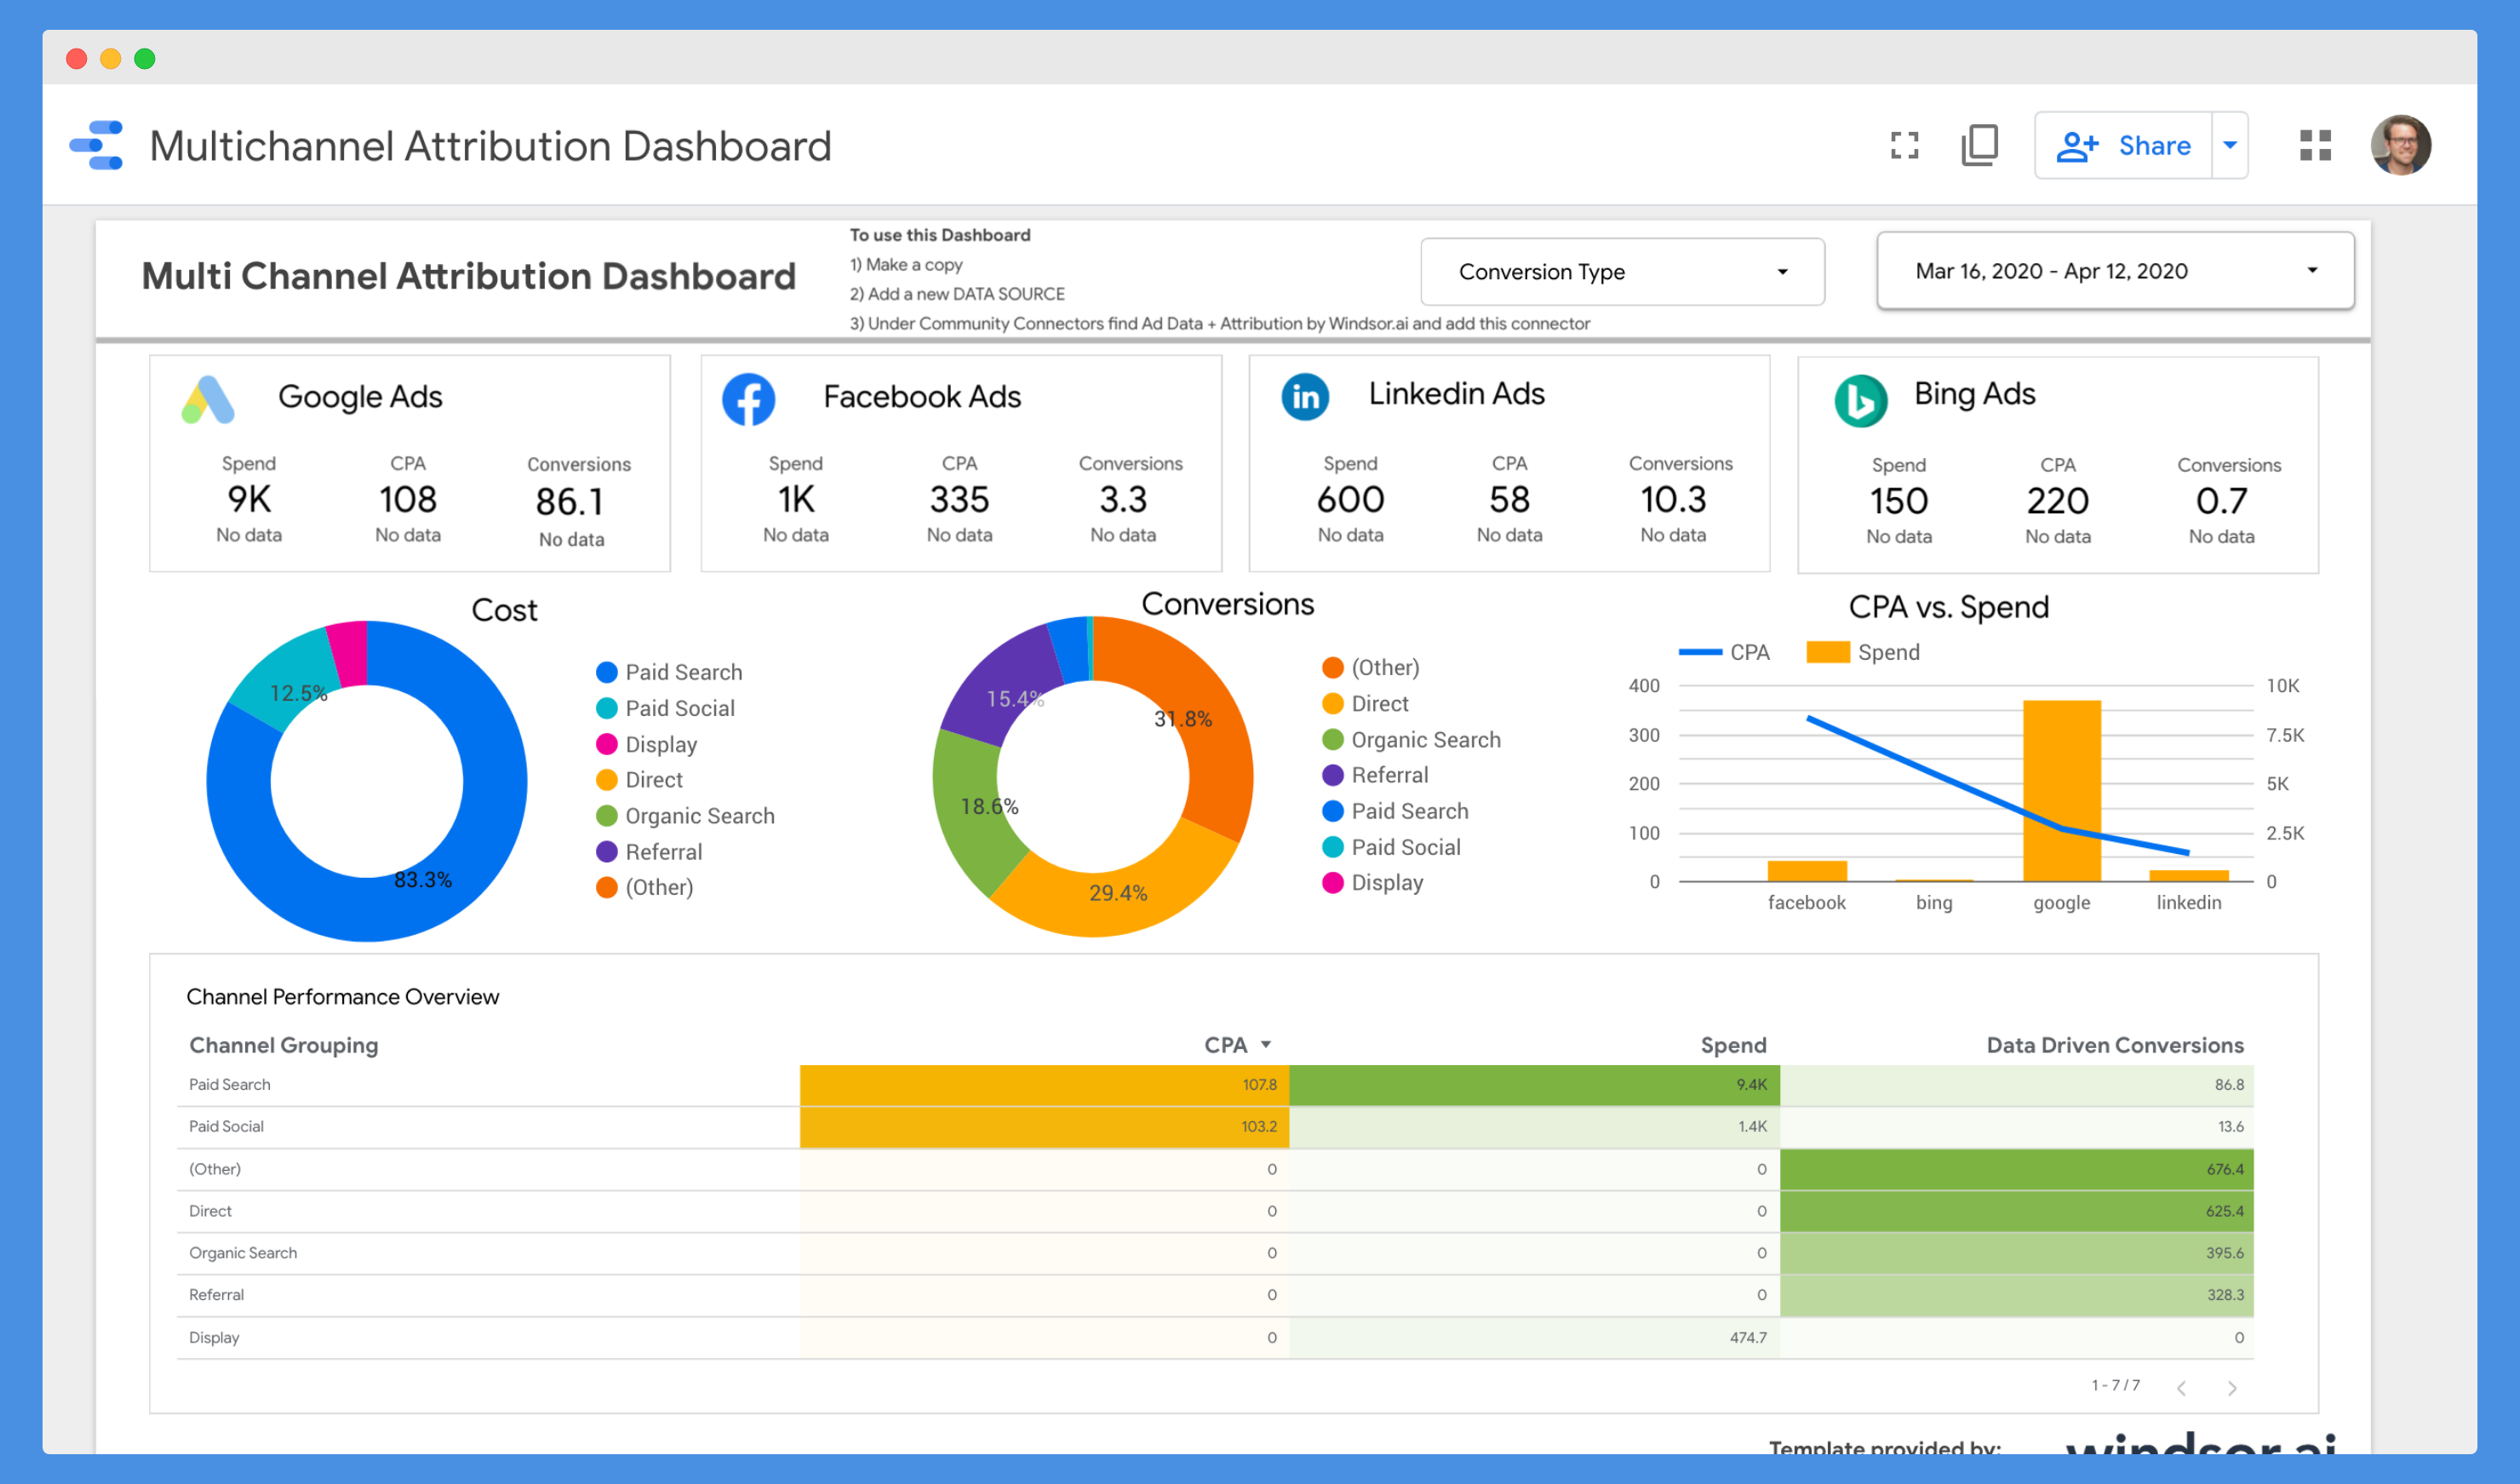
Now let’s see how we can connect business outcomes from your CRM in your marketing reporting.
CRM Conversions
Let’s take a step back. If you are in ecommerce, when working on your reporting, did you ask yourself the question: How many confirmed transactions (not cancelled) did each marketing channel or campaign generate?
For those working with lead forms did you ask yourself: How many qualified leads, opportunities and deals did my marketing channels and campaigns generate?
The best way to go and answer these questions is by connecting your analytics data with your CRM or e-commerce data. You should understand which channel, campaign, ad or keyword brings you valuable conversions. Having insights on what brings you leads vs. qualified leads are different worlds. The ability to present data on qualified leads in marketing report brings credibility. It is evidence that your advertising efforts connect to real-world business outcomes. This Looker Studio CRM attribution dashboard template connects your CRM and analytics data.
You can also find instructions on how to connect your analytics and CRM on the dashboard itself.
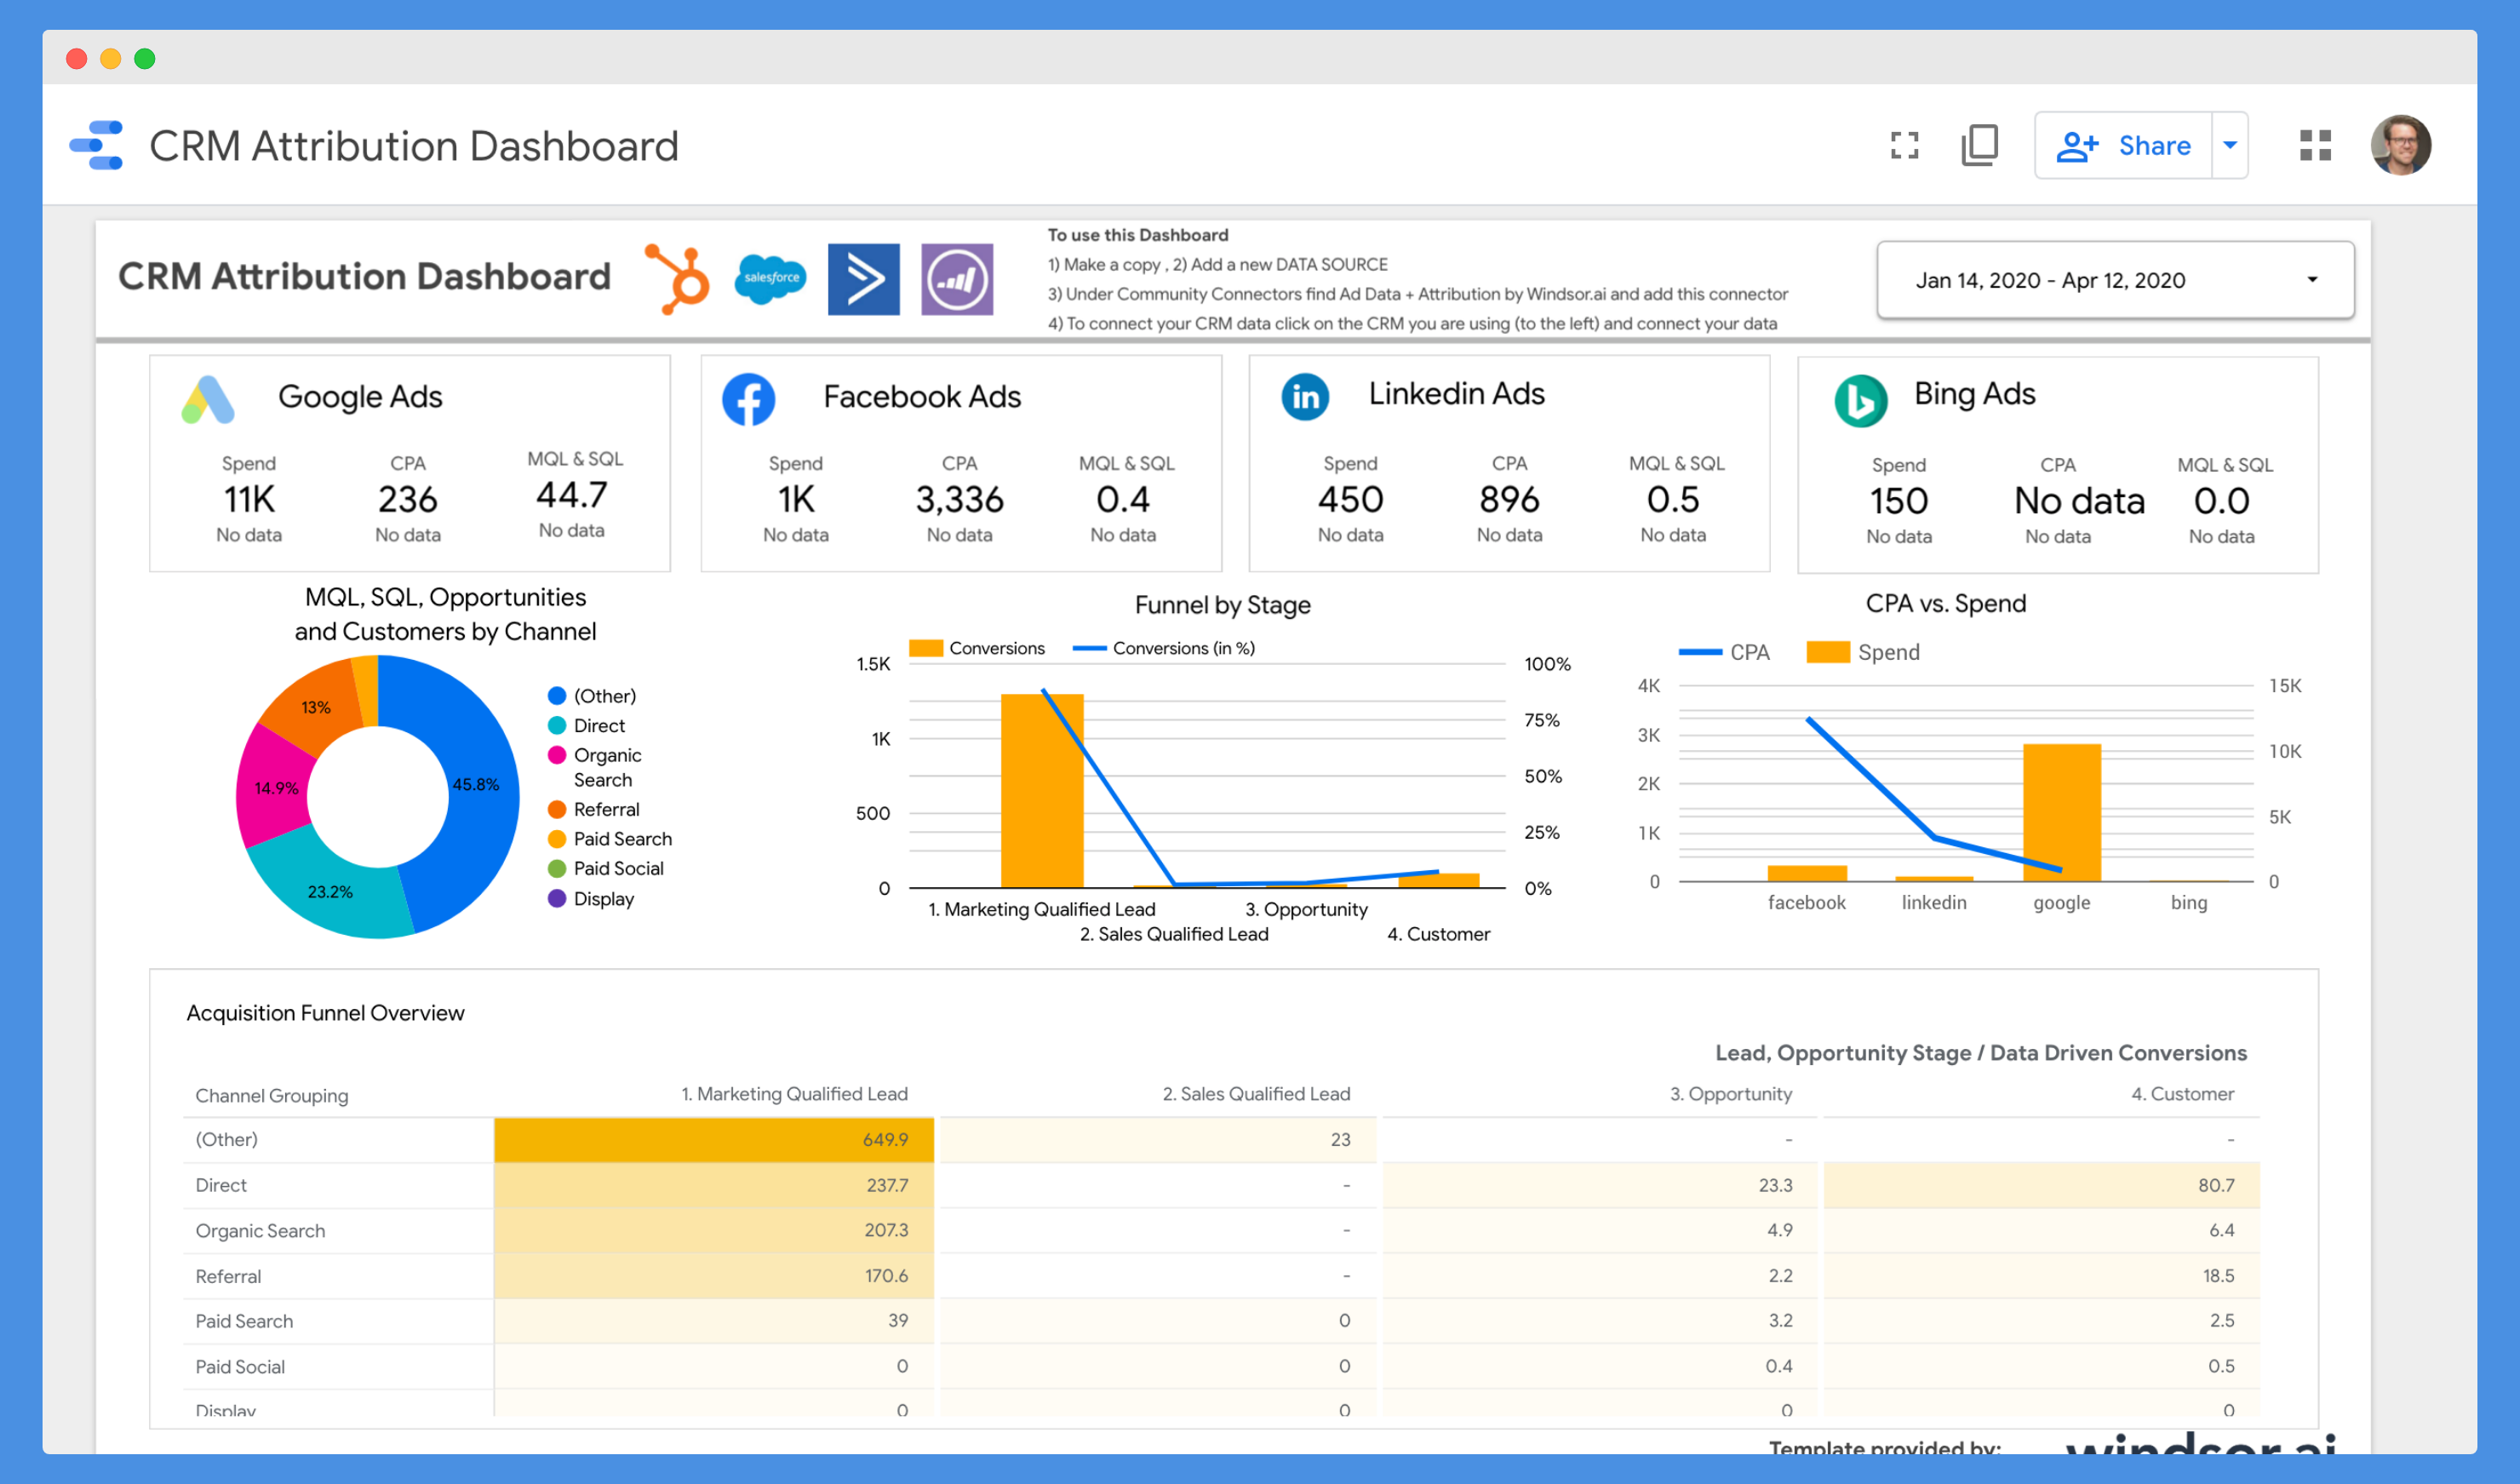
The insights will also tell you which channel bring you junk leads.
For ecommerce, connecting store data to analytics data helps you with net revenue attribution. In hospitality: Connecting your booking engine data to your analytics data uncovers insights. You can understand channels and campaigns with higher return and cancellation rates.
In a next step, let’s look into connecting the revenue which comes with these conversions.
ROI
This is the by far the best way to present numbers in any marketing report. In ROI based marketing reports, the conversion value is added to the conversion. This allows us to connect revenue contribution to the marketing expenditures. If it’s done in an automated way this goes down to a channel, campaign, keyword or even ad level.
In the case of ecommerce this is straightforward as you have the conversion value available in Google Analytics.
You might have a situation where you are in an industry or region where you have to deal with a lot of cancellations or returns.
In the case of form fills, which only convert into opportunities and deals in the CRM system, the data needs matching. More about this in the section CRM conversions. Here is an example of an ROI dashboard
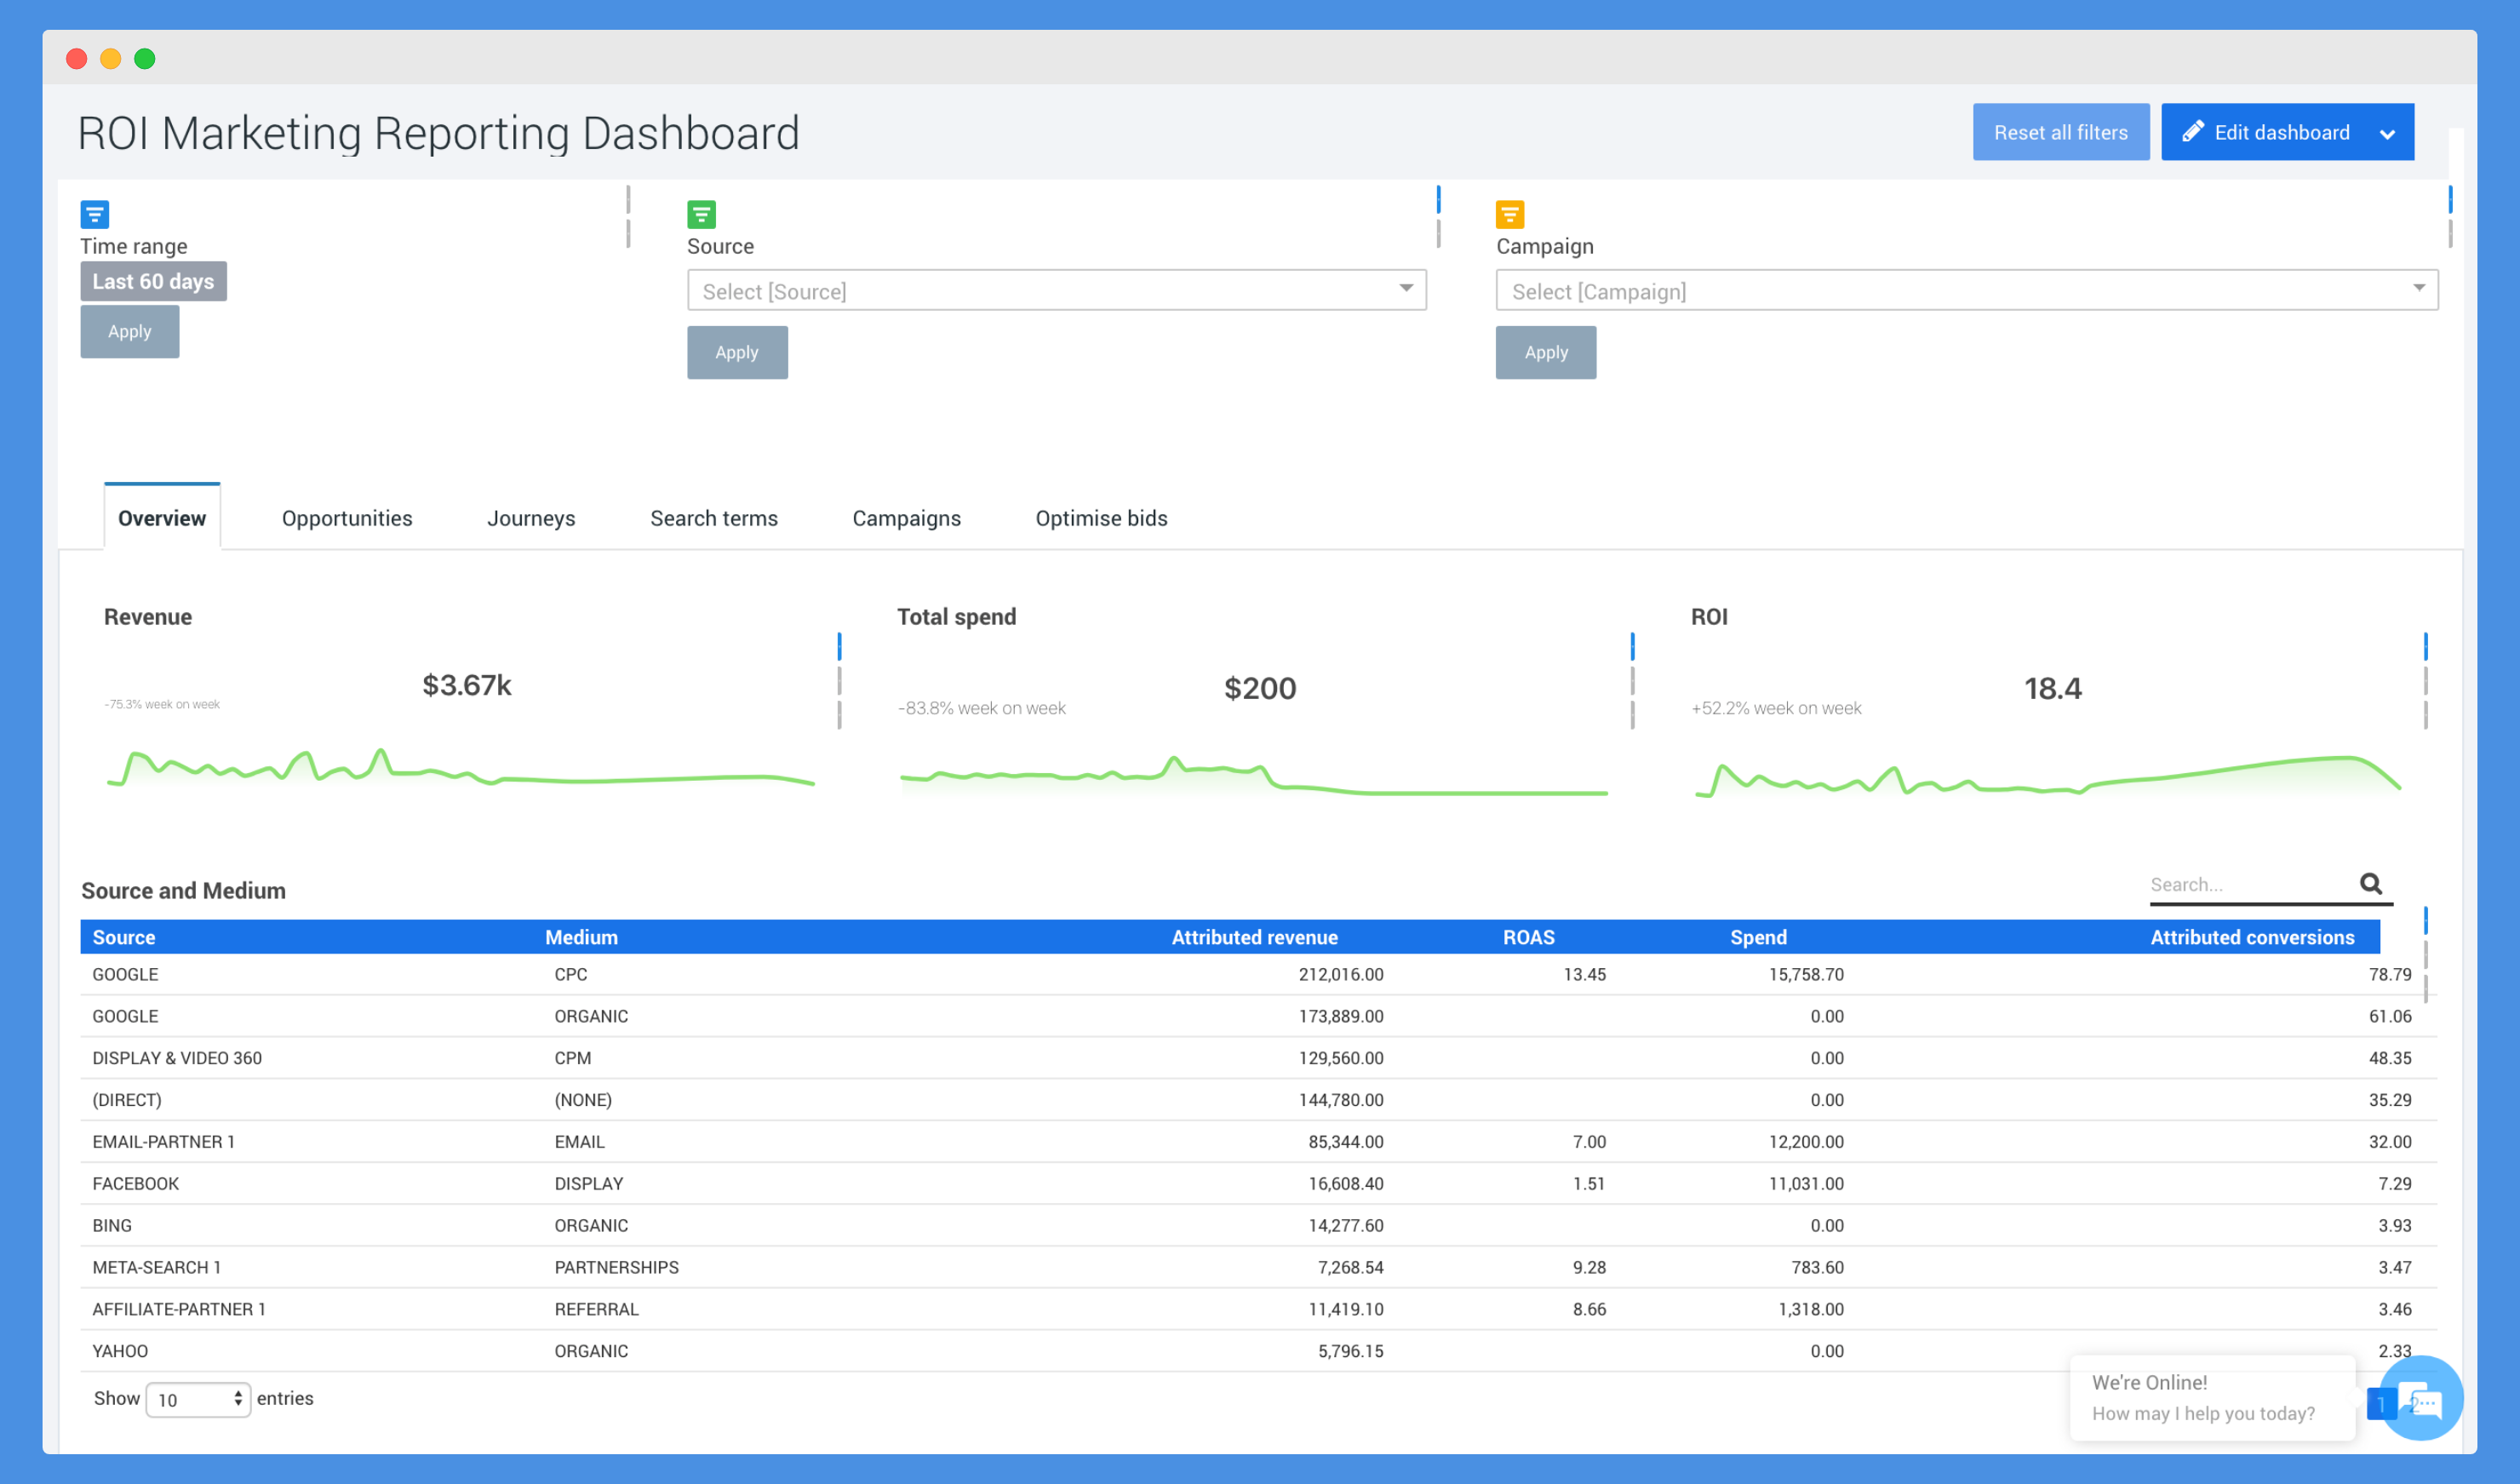
ROI marketing reporting dashboard
To create your own ROI marketing reporting dashboard, you can get started here.
Marketing Attribution
Now that you made it this far you are starting to become an expert in marketing reporting. Independent of technology now you have an understanding of the importance of marketing reporting.
By the way, the most famous tools for data visualisation at the moment (October 2023) are: Google Data Studio, Tableau, Power BI, Google Sheets or Excel
One important topic when it comes to marketing reporting is attribution.
By default Google Analytics and most CRMs provide you information about what touchpoint made the deal. Touchpoints before that will get no credit.
Let me illustrate
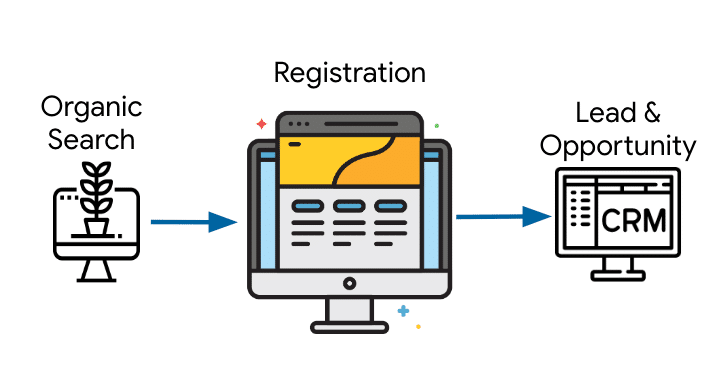
Last Click Journey
In reality the customer more likely looks like this
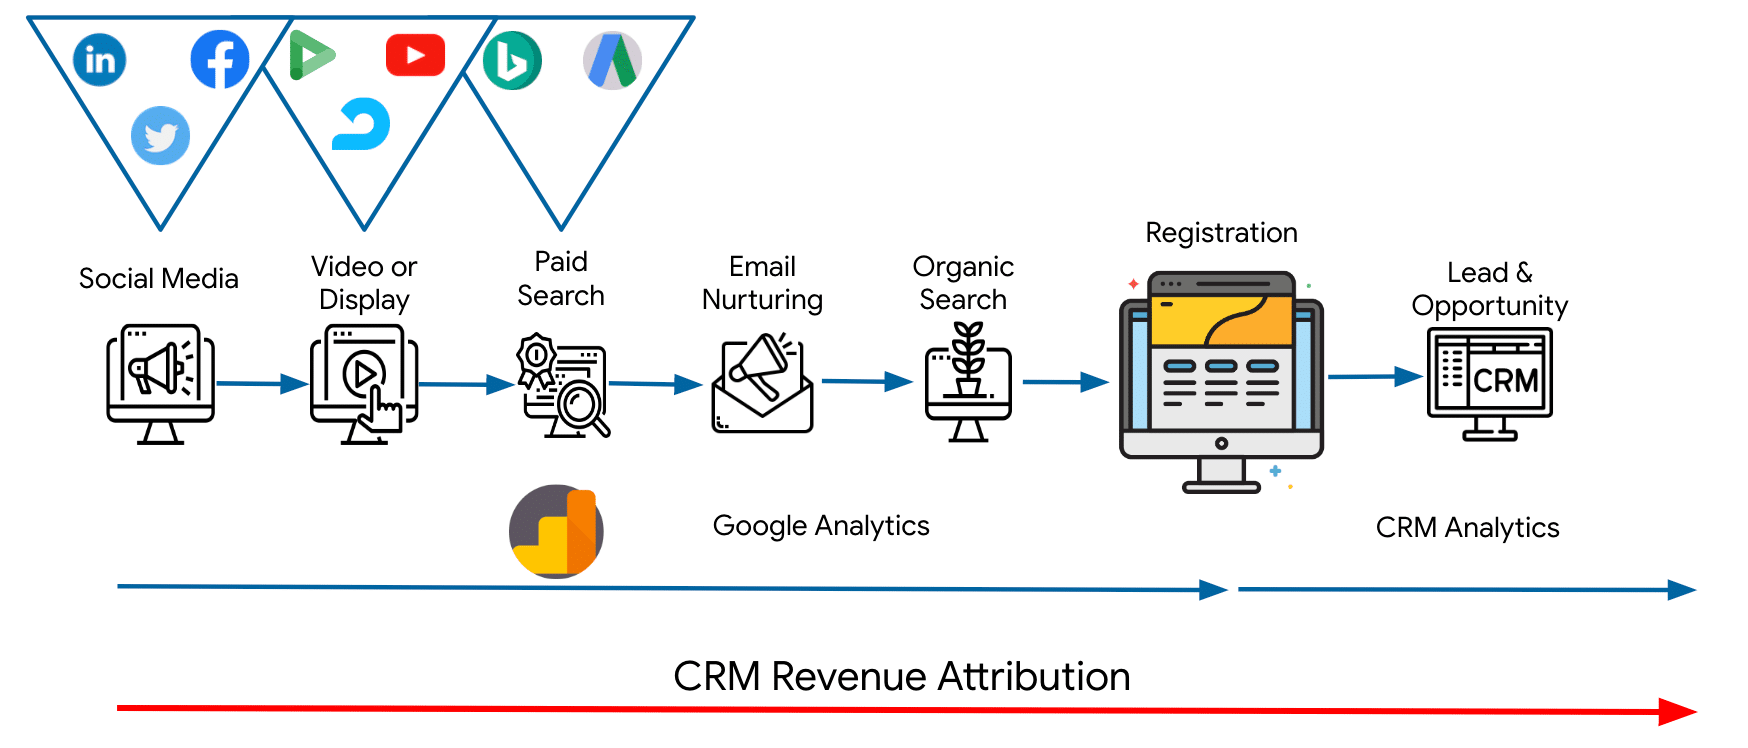
Assigning the correct conversion credit to each touchpoint is multi-touch attribution. If you want to understand the true ROI of each channel you will need to give credit to each touchpoint. I’m not going too much in detail in this article as we cover this topic in other articles on our blog. Model Attribution For Dummies and understanding marketing attribution: models, strategy and benefits cover everything about attribution.

Try Windsor.ai today
Access all your data from your favorite sources in one place.
Get started for free with a 30 - day trial.
Main marketing reporting formats
These are indeed some common formats for presenting marketing reports. Each format serves a specific purpose and may be more suitable depending on the audience and the depth of information needed. Here’s a breakdown of these formats:
- Dashboard
- Advantages:
- Automated and easily updated with real-time data
- Allows for easy comparison with benchmarks
- Considerations:
- May be less insightful for those with limited marketing knowledge
- Requires some setup and configuration
- Advantages:
- PDF Report
- Advantages:
- Provides a structured presentation of data with insights
- Can be customized to highlight specific metrics or insights
- Considerations:
- Requires time to compile and format the report
- May not have real-time data unless manually updated
- Advantages:
- Meeting and Presentation
- Advantages:
- Allows for in-depth discussion of results and insights
- Provides an opportunity for interactive communication and feedback
- Considerations:
- Requires scheduling and coordination.
- Best suited for more detailed quarterly or annual reviews
- Advantages:
- Email
- Advantages:
- Quick and easy for recipients to digest
- Ideal for sharing key performance indicators with stakeholders who prefer concise updates
- Considerations:
- Limited space for detailed explanations or visualizations
- Works best for brief updates, not comprehensive reports
- Advantages:
Choosing the right format depends on factors like the preferences of stakeholders, the depth of information required, and the frequency of reporting. It’s also worth considering a hybrid approach, where different formats are used for different purposes or for different stakeholders.
Conclusion
Marketing reporting is about measuring and reporting what matters. It shouldn’t take you too long to create a good report as there are many templates available on the web. Depending on your stakeholders level of knowledge you might need to drill deep or you need to keep it at a top-level. Being efficient in presenting and preparing the data is key.
Let us get a clear understanding of the benefits of reports building into our regular workflows. Although the worth of marketing is quite clear to us, other people consider marketing as a support function and the money spent on it as a cost. It’s is the place where you feel the need for marketing reporting.
Marketing reporting can help you prove the worth of marketing. For example, if you can show how your campaigns are generating leads, bringing revenues, and fulfilling the business goals. Then you can prove the value of your and your departments and their efforts.
However, marketing reports help you get a clear idea about how things are working and what needs to be improved, and where we should spend our budget and give our efforts. A marketing report can answer all these questions and help you make the best business decision.
An important consideration if you don’t have a template yet is: Do I work with a manual or an automated report? I recommend the latter as it will save you lots of work and removes the chance of human error.
To create simple and powerful automated reports consider signing up for a Windsor.ai free trial.
FAQ:
What is a marketing report?
A marketing report compiles data from various marketing channels, offering an overview of your business’s marketing endeavors, complete with key performance indicators.
These reports encompass details about:
- Marketing strategy
- Market research
- Promotional activities
- Advertising and email campaigns
- Objectives
- Anticipated results
Why marketing reports are mandatory?
In the past, most marketing efforts were offline-based. Their way of measuring outcomes was using panels. We now live in a new era where the opposite is true: There are too many metrics we are able to track. Marketing reporting helps us to understand what metrics to watch and how to action on them to achieve our goals.
1. The first aspiration is conceivably the most determining one. Tracking where exactly customers are while they are spending time during the visit of the website, is crucial to Presenting them what they need.
Are they using their mobile device to be reached? what is their spending capacity? When they are supposed to purchase?
2. How about calculating and giving the return on your marketing activities? Don’t worry, we can understand. It is the biggest objection for marketers out there.
What you need to do is to use the collected data and place it in your business context. It could be an entire marketing mix or a partial mix? could encompass a single platform or multiple channels?
Note: Acknowledge the variables before you deal with the calculations.
3. The third point is understanding the alignment of goals and actions, in particular between the marketing and sales divisions.
Marketing and sales teams generally work too closely. Though, it is usual that data moves across the organization – without getting stuck in the depository, and the team can do required amendments to hit the company’s targets.
What are the benefits of a good market research report?
Let us get a clear understanding of the benefits of reports building into our regular workflows. Although the worth of marketing is quite clear to us, other people consider marketing as a support function and the money spent on it as a cost. It’s is the place where you feel the need for marketing reporting.
However, marketing reports help you get a clear idea about how things are working and what needs to be improved, and where we should spend our budget and give our efforts. A marketing report can answer all these questions and help you make the best business decision.
You May Be Also Interested in:
- Use Cases for Power BI in Digital Analytics
- What is the difference between Looker Studio and Power BI?
- Challenges of B2B Marketing Attribution
- Best Marketing Automation Report Templates
- Best Lead Generation Dashboard Templates
- Best Data Analyst Report Templates
- Best Marketing Automation Report Templates
- Best SEM Report Templates
- Best Free & Paid Looker Studio Connectors in 2023
- 15 Best Looker Studio Example Dashboards And Reports
