The beauty of Pay-Per-Click (PPC) is that we have so much data at our fingertips and we can make changes almost instantly.
But, it can be tricky.
Each Metric & Dimension has its own purpose and goal behind it.
But when it comes down to it, each campaign should have its specific KPIs and these should be the main focus.
How to Measure the Success of Your PPC Campaigns
Ultimately, the most important metric to track is the one that meets your business goals. Before employing a PPC campaign, it’s important to determine your aim.
What is this campaign for?
If you had to explain to your stakeholders the value of this campaign, how would you go on about it and its impact on the organization?
The point is that the most important metric that you track should be the one that aligns with your campaign’s end goal.
Key Performance Metrics lays the foundation of any effective PPC marketing campaign.
However, the importance is not given to metrics that can assist them in tracking the failure or success of their PPC investments.
They focus equally on other complicated factors to measure the impact of their PPC marketing which keeps them away from identifying and measuring the data that matters.
Performance tracking is essential for every marketing strategy, but for PPC it matters a lot because you invest a certain amount of budget on it, and expects better results than other marketing channels.
If the results are not what you expected, then it hurts because you not only have to bear the loss of time but also have to deal with the financial burden as well. To overcome these issues, you must understand and track all the key PPC performance metrics, which will help you in gauging the performance of every cent spent.
To help you with your goal of getting the best ROI from your paid ad campaigns, we have highlighted all the essential PPC Performance Metrics you should be monitoring.
The KPIs & metrics listed below support most of the common marketing goals.
PPC Performance Metrics:
1 – Clicks
Clicks are one of the important PPC Performance metrics because it all starts with them. Clicks are all about the number of people who click on your business ads.
They generally are the simplest and most commonly used metric to identify performing vs. non-performing ads.
2 – Click-Through Rate
Click-Through Rate is the number of clicks that your ad receives against the number of times they are viewed.
Let’s suppose your PPC ad receives 500 impressions and it’s clicked 50 times then the CTR of your campaign will be 10%.
A good or higher CTR shows that your ad is relevant and it helps users find the right service/product.
3 – Quality Score
Quality score is an essential metric that shows the relevancy of your PPC ad content on Google Ads.
Different factors like the format of the ad, landing page experience, CTR, and more are measured before assigning the quality score to an ad. It makes it a bit tough to understand as compared to other metrics.
4 – Cost Per Click
Cost per click (CPC) is the amount of money that an advertiser pays for each on their ad(s).
You can easily find the CPC of an ad by dividing the total cost of your campaign by the number of clicks it received.
Ideally, the lower the CPC, the better, and PPC experts continually work on pushing it down.
5 – Average Cost per click
This is the same as the Cost per Click but is usually taken as an average of multiple ad units or campaigns to measure the average cost of click across the entire spend.
6 – Cost Per Acquisition (CPA)
Cost per acquisition is the actual cost to an advertiser when he acquires a customer.
Concerning PPC, this is the cost the advertiser spends on ads and campaigns to acquire a customer.
Cost per acquisition is calculated by dividing the total spent on PPC Campaigns by the actual number of the customers acquired.
For example, if you spent $5000 to acquire 10 customers, your CPA will be $500 or $500 for each customer.
Similar to CPC, one of the primary goals of the advertiser is to have the lowest CPA possible.
7 – Conversion Rate
The conversion rate paints a good picture of the success of your campaigns.
The conversion rate is the average number of visitors (or clicks) converting into leads or customers.
Let’s say, your e-commerce website gets 100 clicks in a week, and you get 20 sales from them, your conversion rate will be 20%.
In ideal scenarios the higher the conversion rate, the better.
8 – Impression Share
Impression share is all about how many times a person views your ad.
Impression share doesn’t consider the relevancy or click-throughness of the ad but only provides an insight into the reach of your ad.
This metric is useful for brand awareness campaigns as it helps with product recall and brand value.
9 – Average Position
The Average Position determines your rank amongst other ads on search results. (This is not an organic metric).
The average position of an ad is calculated by multiplying the quality score of your ad with its maximum cost per impression.
Tip: You cannot get the first position by merely increasing your bid because the quality score also has equal weight in deciding which ad will be on top of all.
10 – Budget Attainment
Budget attainment provides the monthly budget that was set to be spent on ads.
Sometimes, it is tough to meet the predefined budget requirements, and you have to increase the budget to run your campaigns successfully.
This metric will spot whether your ads were under the budget that you specified for your campaigns or they take more than that.
11 – Customer Lifetime Value (CLV)
Lifetime value is the total profit or spending that is expected across the entire relationship with a customer.
Regarding PPC, this is used to evaluate and compare the CLV of a PPC acquired customer with other channels.
This can help you with understanding the quality of customers coming in from PPC campaigns.
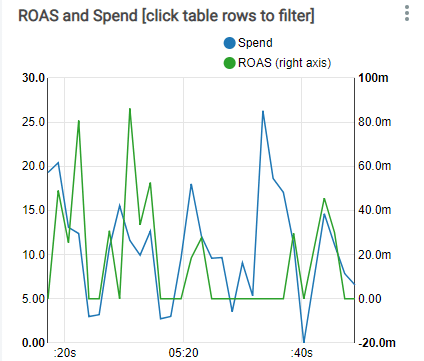
12 – Return on Ad Spend (ROAS)

Calculate ROAS in Windsor.ai
Return on Ad Spend (ROAS) is the quantity of revenue that a business gets after spending a specific budget on ad campaigns.
It is one of the most commonly and heavily regarded PPC metrics as it gives a high-level overview of paid ad campaigns.
The more return you get on your ads, the more successful will be your ad campaigns.
To understand it better, suppose your e-commerce business generates revenue of $10,000 after spending a budget of $2000 then your return on ad spend will be 500%.
13 – Bounce Rate
Bounce rate is the number of visitors that only viewed your landing page or had only interaction with your website and left.
The bounce rate of PPC campaigns, when compared with other channels helps you understand the quality of paid campaigns and their conversion rate.
Ideally, the lower the bounce rate, the better it is.
14 – Cost Per Mille / Cost per thousands of impressions (CPM)
Cost per mile is the amount of money that an advertiser pays to Google after getting one thousand impressions on their ad.
This metric has nothing to do with the click and conversions because it only cares about the impressions or views on ads.
They are suitable for branding and exposure activities as the overall cost of a thousand impressions is significantly lower than the same amount of clicks.
15 – Average Order Value
The average order value helps in understanding the buying behavior of in-coming customers from PPC.
Dividing the number of orders by the revenue of all customers acquired through paid campaigns is considered as Average Order Value
For example, your online mobile store generates $50,000 from 5,000 orders; then your average order value will be $10.
16 – Ad Cost to Sale
Ad Cost to Sale is the average percentage of ad costs in acquiring a sale. Rather than a number, this is a percentage metric.
Ad Cost to Sale is measured by dividing total sales by total ad cost and multiplying it by a hundred to get the average value.
To understand further, suppose you spend $5 on your store, and you get a sale of $250, your ad costs to sale will be 2%.
17 – Cost Per Lead (CPL)
Similar to cost per acquisition, cost per lead measures the average cost of acquiring a lead.
We measure it by dividing the number of leads that you received by the cost of generating those leads.
This metric helps you understand the amount of budget you spend on getting a single lead.
18 – Average Page Views per Visit
Average page views per visit are the average number of pages visited by a visitor in a single visit to your website.
Let’s suppose a visitor comes to your website and visits multiple pages in that same session. The total number of pages in that session for all visitors is the average page views per visit.
This metric has its value among others because the more time a visitor spends on your website, the more will be the possibility of a conversion.
19 – Average Cost per Page View
The average cost per page view is the cost you have to pay for each page view from PPC Campaigns.
This metric is generally helpful in brand awareness campaigns as it helps you measure how much budget you need to invest in PPC to get a certain amount of visitors.
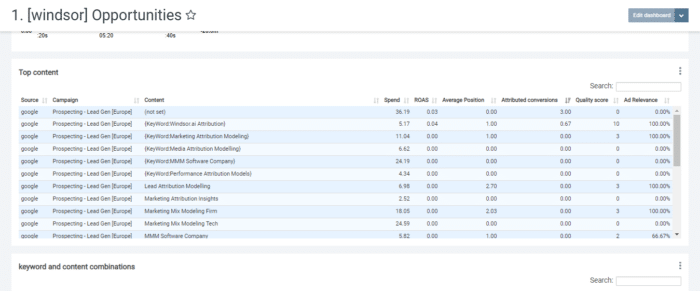
20 – Top Landing Pages

Top Content in PPC Campaigns
Top landing pages, as it states, help you identify your top landing pages as far as conversion is concerned from PPC Campaigns.
This helps you in understanding how good the conversion rate of a landing page is for all paid traffic.
21 – Customer Retention Rate
Customer retention rate tells about the loyalty of your customers.
Regarding PPC campaigns, the retention rate helps you identify how long the customers will stay with your business if acquired from PPC campaigns.
The higher the conversion rate, especially if compared with other channels, the better your quality of PPC acquired customers.
22 – Low impression share
Low impression share is the number of impressions that you are losing due to certain conditions.
If your impression share is meager due to a budget, you should either remove underperforming keywords or narrow down on your geographic reach.
If your impression share is too low due to ad rank, then you need to work on bids or Quality scores.
23 – View-Through or Assisted Conversions
A view-through conversion occurs when a user sees your ad, does not click through, but later directly visits your site or finds it organically and converts.
In this case, it is highly likely that your ad played a part in the conversion even if it didn’t play a direct role.
This can be validated through attribution modeling that gives credit to the conversion to the correct channel.
24 – Keyword Performance
Usually, an under-rated metrics, sunk within all the monetary parameters, keyword performance helps you identify which keywords;
- Have the best, lowest, highest CPC
- Resulting in conversion
- Good for branding and more
25 – Ads and Campaigns Performance
It is extremely significant to evaluate each ad or Campaign on par with the metrics above to identify the best and least performing ads and campaigns.
As a Matter of fact, For every business, there are high-performing and low-performing ads and campaigns, which help you focus your budget on where matters and pull out from where you are losing it.
The PPC Performance Metrics discussed above are the nuts and bolts of any successful PPC marketing campaign, its also important to take care of ppc budget pacing to make sure your ads are spending it correctly.
How Windsor.ai Can Guide you to Anticipate Your Key Performance Metrics
With an observation of your ad performance, it’s easy for performance marketers, advertising experts, and social media managers to figure out the complicated multi-channel attribution and make an effective resolution and planned corrections.
Windsor.ai permits you to significantly frame a large range of sharp and affluent data visualizations, monitoring all your KPIs at any time.
With Windsor.ai you can merge together data from sources over the whole business, as well as assist your decision-makers to move rationally on the KPIs that are significant to you, as well as to warm up into the data to spot inconsistencies, orientations, and revenue opportunities.
Additionally disclosing your metrics clearly, your marketing team will regulate in full control of campaigns and commit to the prosperity of the whole company.
Want to Boost the Performance of Marketing? , book a Free Demo of Windsor’s Marketing Attribution Software, to see how it helps you get the best out of your marketing activities.
You might also be interested in…
